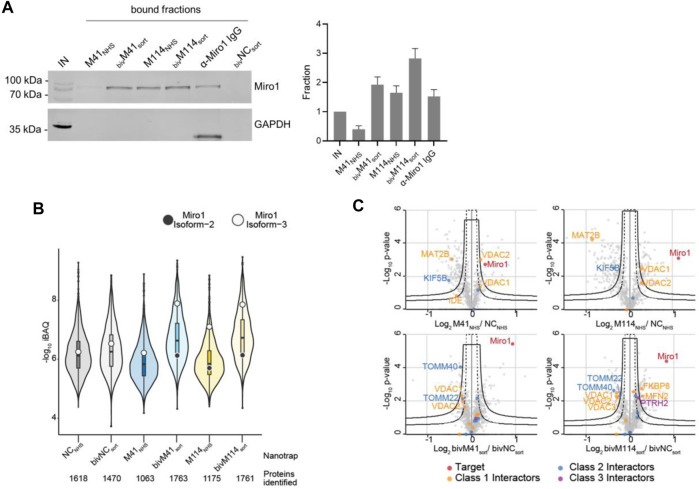
FIGURE 5.
Proteomic analysis of Miro1 capture. (A) For comparable immunoprecipitation soluble protein fraction of HEK293 cells were incubated either with monovalent Nbs either chemically coupled to NHS sepharose (M41NHS, M114NHS) or the bivalent formats, which were site specifically conjugated to agarose particles by sortagging and click chemistry (bivM41sort, bivM114sort). Input and bound fractions were analysed with an anti-Miro1 antibody. As positive control anti-Miro1 IgG immobilized on Protein A/G sepharose and as negative control a non-specific bivalent and site specifically conjugated nanotrap (bivNCsort) was used. Shown is a representative immunoblot stained with an anti-Miro1 antibody. For densitometric evaluation immunoblot signals of endogenous Miro1 in the corresponding bound fractions were normalized to the Miro1 signal in the input, which was set to 1. Shown are the mean signals from three independent biological replicates ±SD. (B) Capture efficiency by mono- and bivalent nanotraps. Averaged iBAQ (intensity based absolute quantification) values for Miro1 isoform 2 (white circles) and isoform 3 (black circles) of three biological replicates are shown. (C) Classification of Miro1 interactor based on STRING database. Class 1: direct interactor, confidence score >0.9; Class 2: direct interactor, confidence score <0.9; Class 3: indirect interactor, confidence score >0.9.

