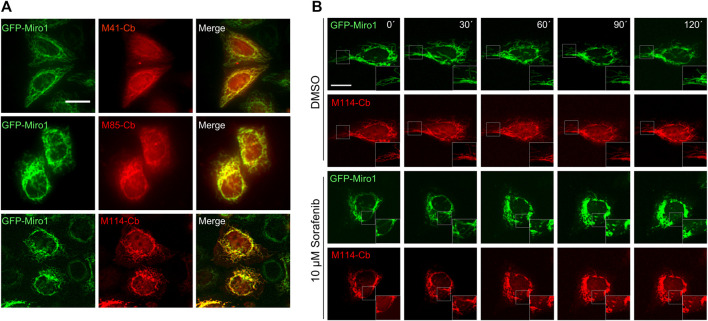
FIGURE 6.
Live-cell imaging of Miro1 with selected Miro1-Cbs. (A) Representative fluorescence images of living HeLa cells transiently expressing GFP-Miro1 (left column) in combination with red fluorescently labelled (TagRFP) M41-, M85- or M114-Cb (middle column). Scale bars 20 µm. (B) Time-lapse microscopy of U2OS cells transiently expressing GFP-Miro1 in combination with either M114-Cb or mito-Mkate2. To visually track morphological mitochondrial changes, cells were treated with either DMSO as a control (top two rows) or 10 µM Sorafenib (bottom two rows) followed by time-lapse imaging over a 2 h period. Shown are representative images of three biological replicates. Scale bar 25 µm. Squares at the bottom right represent enlargements of the selected image section.

