FIGURE 7.
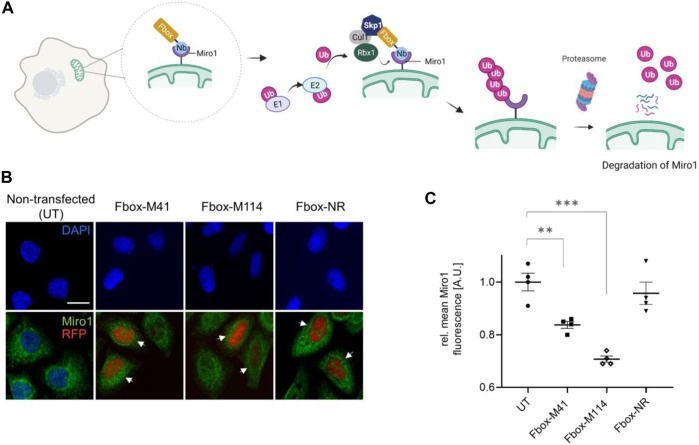
Targeted intracellular degradation of endogenous Miro1 by Fbox-Nb-based degrons. (A) Schematic illustration of the targeted degradation of Miro1 mediated by Miro1-Nb-Fbox fusions (illustration created with Biorender.com). (B) Representative confocal images of HeLa cells transiently expressing indicated Miro1-specific Fbox-Nbs (Fbox-M41 and Fbox-M114) or a non-related Fbox-Nb (Fbox-NR) construct. For quantitative IF analysis, cells were fixed and permeabilized 24 h after transfection followed by detection of endogenous Miro1 with Miro1 antibody (shown in green). Fbox-Nb expressing cells were identified by a nuclear TagRFP signal (white arrows) and subjected to automated image analysis and quantification as described in Supplementary Figure S13 and Material and Methods. Scale bar 20 µm. (C) Mean Miro1 fluorescence intensity from HeLa cells expressing Fbox-Nbs determined by quantitative fluorescence imaging. Mean Miro1 fluorescence was calculated from four samples (N = 4; n > 500 cells) and normalized to untransfected cells, UT (set to 1). As control, a non-related Fbox-Nb construct (Fbox-NR) was used. Data are represented as mean ± SEM. For statistical analysis, student’s t-test was performed, **p < 0.01, ***p < 0.001.

