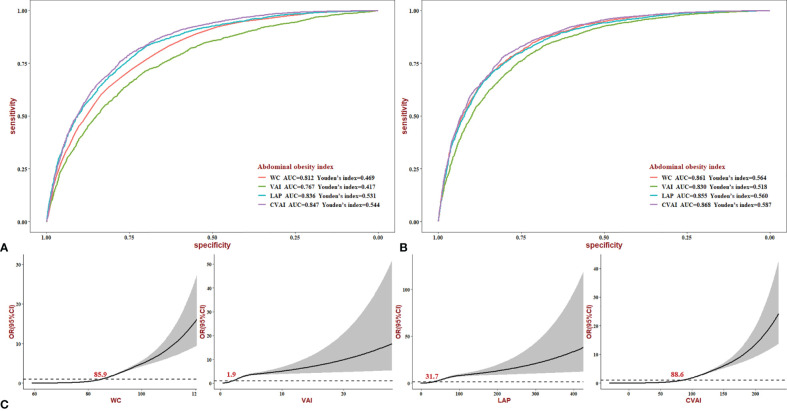
Figure 5.
ROC and dose–response curves of abdominal obesity indices for NAFLD. (A) Crude ROC curves. (B) Adjusted ROC curves (age, sex, current smoking, current drinking, income, education level, hypertension, diabetes, BMI, SBP, DBP, FBG, HDL, TC, hypertension, and diabetes.). (C) Dose–response relationship between the risk of NAFLD and changes in WC, VAI, LAP, and CVAI level. NAFLD, non-alcoholic fatty liver disease; BMI, body mass index; SBP, systolic blood pressure; DBP, diastolic blood pressure; FBG, fasting blood glucose; HDL, high-density lipoprotein; TC, total cholesterol; WC, waist circumference; VAI, visceral obesity index; LAP, lipid accumulation; CVAI, Chinese visceral obesity index.

