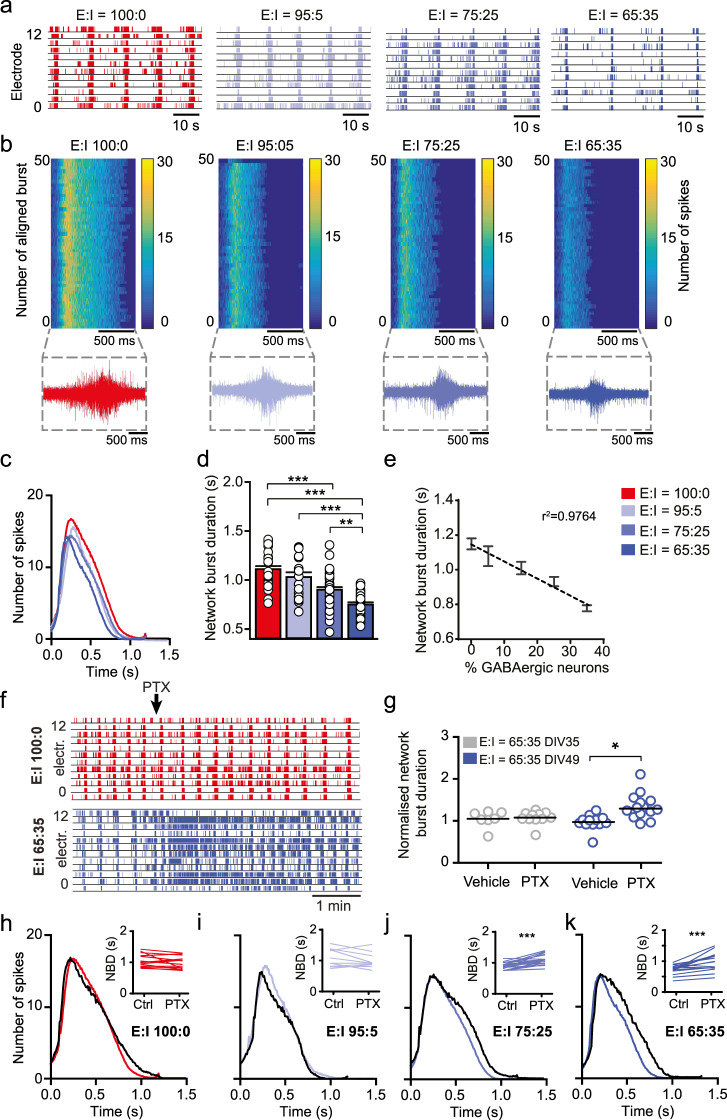
Fig. 3. iGABAA-FSK show scalable functional inhibition on the neural network at DIV 49.
a Representative raster plots showing 60 s of activity recorded from E:I 100:0 (red), 95:5 (light blue), 75:25 (blue), or 65:35 (dark blue) networks at DIV 49. b Representative network burst alignment from one recording of E:I 100:0, 95:5, 75:25, or 65:35 networks, color code represents the number of spikes. Inset: representative network burst. c Average network burst shape of representative cultures from 100:0, 95:5, 75:25, or 65:35 networks at DIV 49 (E:I 100:0 cultures n = 20, 95:5 n = 12, 75:25 n = 23, and 65:35 n = 26 individual wells. For E:I 65:35 networks p = 0.008, multiple t-test on bins using Holm–Sidak method). d Quantification of the average network burst duration of E:I 100:0, 95:5, 75:25, and 65:35 networks (E:I 100:0 n = 29, 95:5 n = 20, 75:25 n = 38, and 65:35 n = 38 individual wells, Kruskal–Wallis Two-way ANOVA was performed between ratios at DIV 49, corrected using the Dunn’s method). e Linear regression plot of the average network burst duration from 100:0, 95:5, 85:15, 75:25, or 65:35 cultures at DIV 49 (y = −9.628x + 1109, p = 0.0119). f Representative raster plots of 5 min showing the effect of acute 100 µM picrotoxin (PTX) treatment on E/I 100:0 and 65:35 networks at DIV 49. g Normalized network burst duration of E/I 65:35 networks treated acutely with vehicle or PTX at DIV 35 and 49, normalized to their respective baseline recording (DIV 35 + vehicle n = 8; DIV 35 + PTX n = 11; DIV 49 + vehicle n = 12, and DIV 49 + PTX n = 15 individual wells, Mann–Whitney test with post hoc Bonferroni correction was performed). Quantification of network burst shape after acute PTX treatment in h 100:0, i 95:5, j 75:25, and k 65:35 cultures at DIV 49 (black line indicates the average burst shape of wells treated with PTX, E:I 100:0 n = 9, 95:5 n = 6, 75:25 n = 12, and 65:35 n = 11 individual wells, 100:0 p = 0.5582, 95:5 p = 0.1857, 75:25 p = 0.1050, and 65:35 p = 0.0013, multiple t-test on bins using the Holm–Sidak method). Inset: paired t-test of the mean network burst duration before and after treatment with PTX (E:I 100:0 cultures n = 15, 95:5 n = 10, 75:25 n = 19, and 65:35 n = 15 individual wells). DIV days in vitro. All data represent means ± SEM. *p < 0.05, *p < 0.01, ***p < 0.001.

