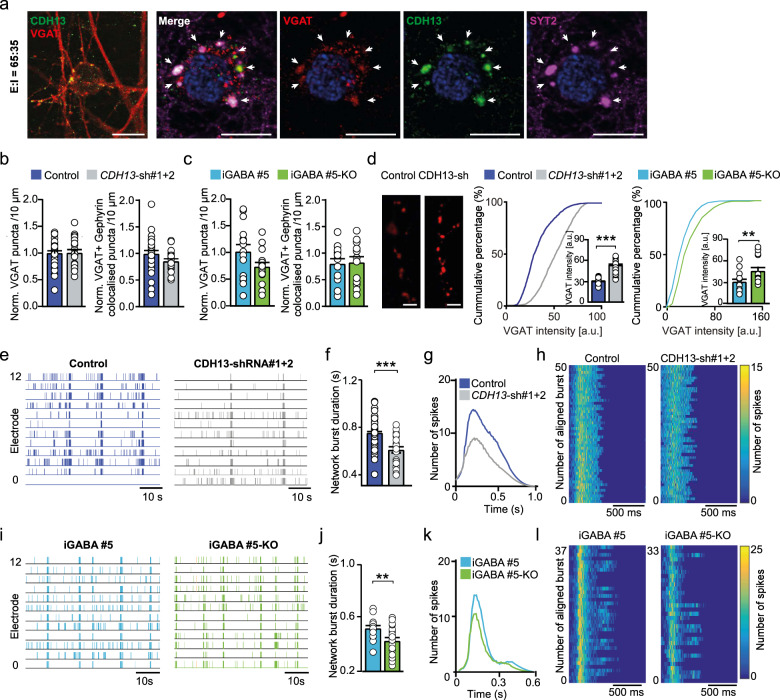
Fig. 4. Knockdown of CDH13 in iGABAA-FSK leads to increased inhibition in E/I networks.
a Co-labeling of VGAT (red), CDH13 (green), and SYT2 (purple) in E/I 65:35 controls at the inhibitory presynapse (scale bar 10 µM). Normalized number of total VGAT-positive puncta (left) and normalized number of VGAT and Gephyrin co-localized puncta (right) in b CDH13-sh#1 + 2-transduced networks or c iGABA#5 and iGABA#5-KO networks at DIV 49. d Representative VGAT staining in E/I 65:35 control and CDH13-deficient networks at DIV 49 (scale bar 6 µM) and quantification of VGAT puncta intensity (arbitrary units, control n = 24, CDH13-sh#1 + 2 n = 26, iGABA#5 n = 13, and iGABA#5-KO n = 15 images from three individual neuronal preparations. Mann–Whitney test with post hoc Bonferroni correction was performed). e, i Representative raster plots showing 60 s of electrophysiological activity recorded from E/I 65:35 control and CDH13-deficient cultures at DIV 49. f, j Quantification of the average network burst duration in E/I 65:35 control and CDH13-deficient networks (Control n = 49, CDH13-sh#1 + 2 n = 31, iGABA#5 n = 20, and iGABA#5-KO n = 21 individual wells from three neuronal preparations. Mann–Whitney test with Bonferroni correction was performed). g, k Average network burst shape of representative cultures from E/I 65:35 control and CDH13-deficient networks at DIV 49 (Control n = 26 and CDH13-sh#1 + 2 n = 12 individual wells, p = 0.00071; iGABA#5 n = 19 and iGABA#5-KO n = 20 individual wells, p = 0.235. Multiple t-test on bins were performed using the Holm–Sidak method). h, l Representative network burst alignment from one recording of E/I 65:35 control and CDH13-deficient networks at DIV 49, color code represents # spikes. All data represent means ± SEM. *p < 0.05; **p < 0.01; ***p < 0.001. DIV days in vitro.

