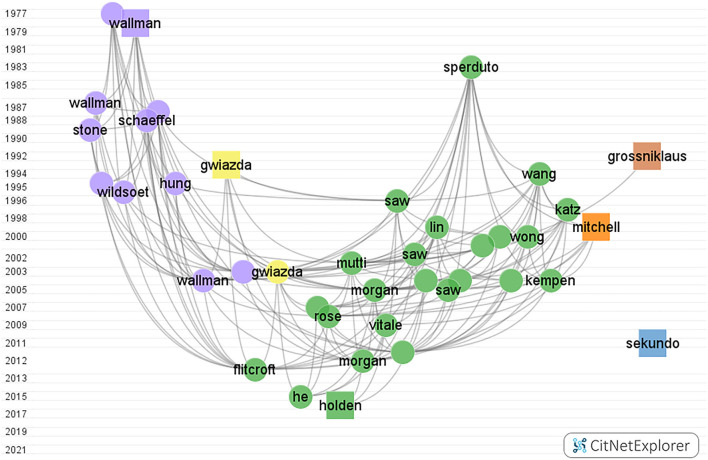
Figure 4.
Myopia citation network graph from CitNetExplorer from 1900 to 2000. The vertical axis coordinates indicate the publication year. Each dot/square indicates a publication which is labeled with the last name of the first author. Each color marks a group. Group 1 to group 6, in turn, were colored green, blue, purple, yellow, orange, and brown, respectively. The square represents the publication with the highest citation score in each group.

