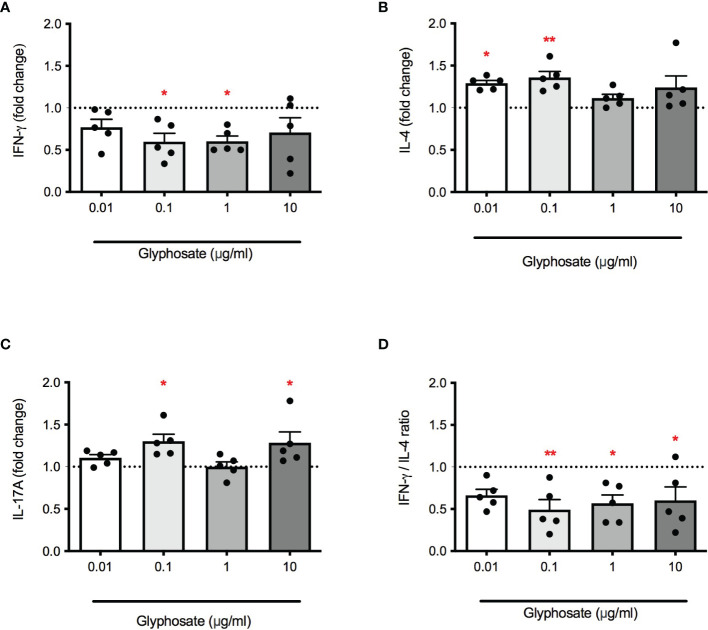
Figure 2.
Effect of G on PMA plus ionomycin-induced IFN-γ, IL-4 and IL-17A release. PBMC (106/mL) were treated for 1 h with increasing concentrations of G (0.01, 0.1, 1 and 10 µg/mL), and then stimulated with PMA and ionomycin for 72 h. Cytokines were measured by ELISA in cell-free supernatants. (A) IFN-γ release. (B) IL-4 release. (C) IL-17A release. (D) IFN-γ/IL-4 ratio. Results are expressed as fold-change of the released cytokines in G treated cells compared to control cells. The dotted line reported is set at 1.0 (control). Each value represents the mean ± SEM, n = 5 donors. Each dot represents the value of the single individual. Statistical analysis was performed with Dunnett’s multiple comparison test, with *p < 0.05 and **p < 0.01 vs control cells.

