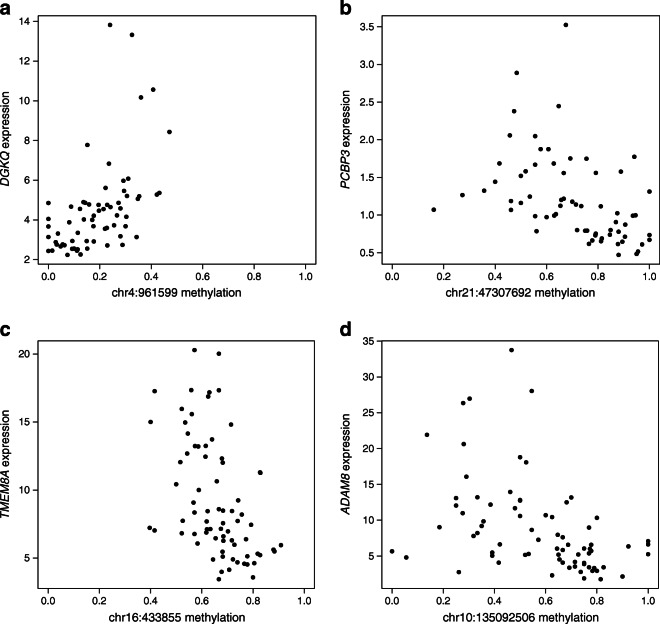
Fig. 5.
Methylation and gene expression correlation analysis. The most highly correlated expression–methylation pairs in CD4+ and CD8+ T cells. Spearman ρ (Spearman’s rank correlation coefficient) is between methylation proportion (x-axis) and reads per kb per million (RPKM)-normalised gene expression level (y-axis). (a, b) Expression–methylation pairs in the CD4+ T cells. The methylation of CpG site chr4:961599 at an intron of DGKQ gene positively correlated (Spearman ρ = 0.619) with gene expression. The methylation of CpG site chr21: 47307692 at an intron of PCBP3 gene showed negative correlation (Spearman ρ = −0.591) with gene expression. (c, d) Expression–methylation pairs in the CD8+ T cells. The methylation of CpG site chr16:433855 near TMEM8A gene inversely correlated (Spearman ρ = −0.538) with gene expression. The methylation of CpG site chr10:135092506 at an exon of ADAM8 gene showed negative correlation (Spearman ρ = −0.520) with gene expression. For a complete list of CpG sites and their correlation with gene expression, please see ESM Tables 3–5, 9–11

