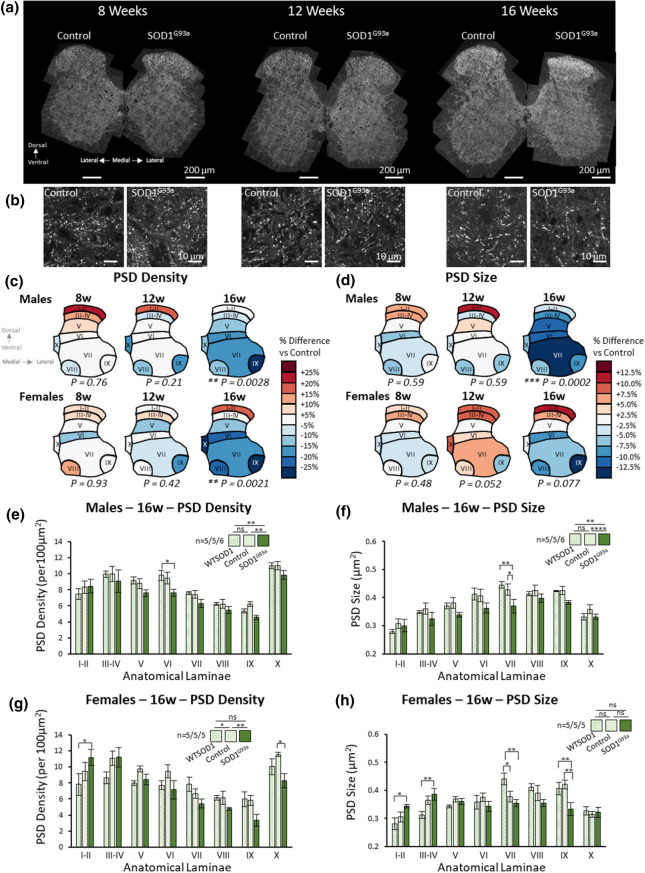
Fig. 1.
Mapping excitatory synapses in the spinal cord revealed early symptomatic stage synaptic changes in SOD1G93a mice. a High-resolution mapping of PSD95-eGFP was performed to analyse synaptic changes in SOD1G93a mice at different time points of the disease. b Example images of postsynaptic puncta in control and SOD1G93a mice at different time points of disease. c Heat maps of PSD density in male and female SOD1G93a mice compared to their respective controls at different ages. d Heat maps of PSD size in male and female SOD1G93a mice compared to their respective controls at different ages. e Chart plotting PSD density in all 8 laminae of 16-week-old controls, WTSOD1 controls and SOD1G93a males. Sample sizes denoted as n = number of WTSOD1’s/number of controls/number of SOD1G93a’s. f Chart plotting PSD size in all 8 laminae of 16-week-old controls, WTSOD1 controls and SOD1G93a males. g Chart plotting PSD density in all 8 laminae of 16-week-old controls, WTSOD1 controls and SOD1G93a females. h Chart plotting PSD size in all 8 laminae of 16-week-old controls, WTSOD1 controls and SOD1G93a females

