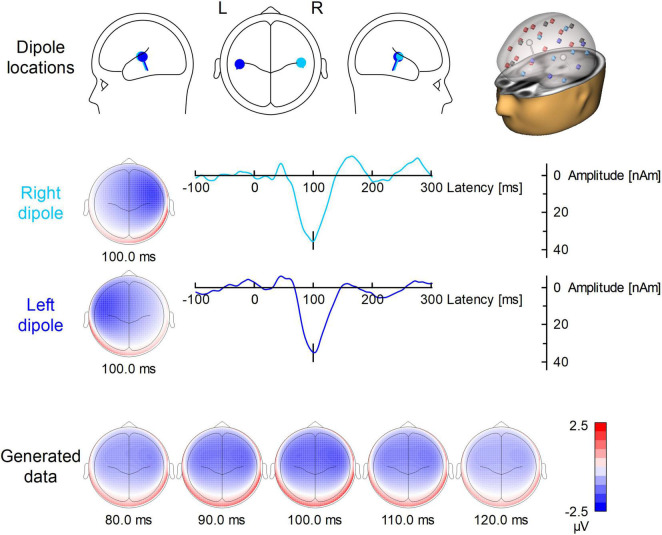
FIGURE 1.
Dipole model used for the simulation of auditory ERP. In the first row, the locations and orientations of the two dipoles are depicted in the head scheme. On the right, the modeled dipoles are shown in the presence of the surrogate model used for BCG artifact correction. The 29 regional sources for surrogate brain model are color-coded (red for right hemisphere, blue for left hemisphere, gray for midline). The modeled sources (which are not part of surrogate brain activity model) are shown in white. The second and third row show the left and right dipole source waveforms along with their topographies. Below, the evolution of the N100 topography from 80 to 120 ms is depicted.

