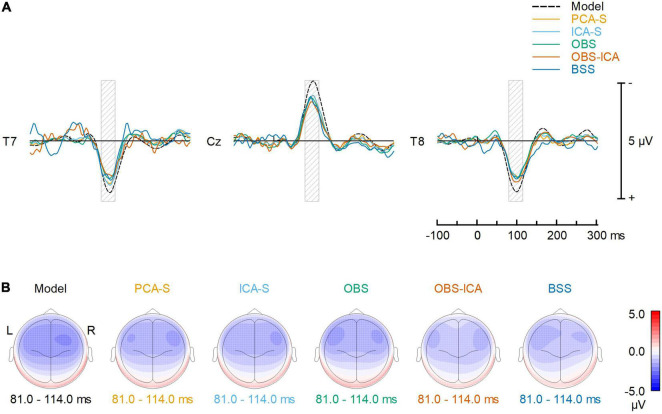
FIGURE 4.
Comparison of the BCG artifact reduction methods. (A) The signals recovered at T7, Cz and T8 electrodes (virtually re-referenced to the average reference) are compared to the noise-free, simulated AEP signal. Each solid color line represents one of the 5 different BCG artifact reduction methods; the dashed line (Model) represents the simulated AEP signal. (B) Topographic plots of averaged ERP response for the simulated AEP signal and the BCG artifact reduction methods in the range 81–114 ms (full width at half maximum of the modeled signal power, as illustrated by the gray shaded areas in the top row).

