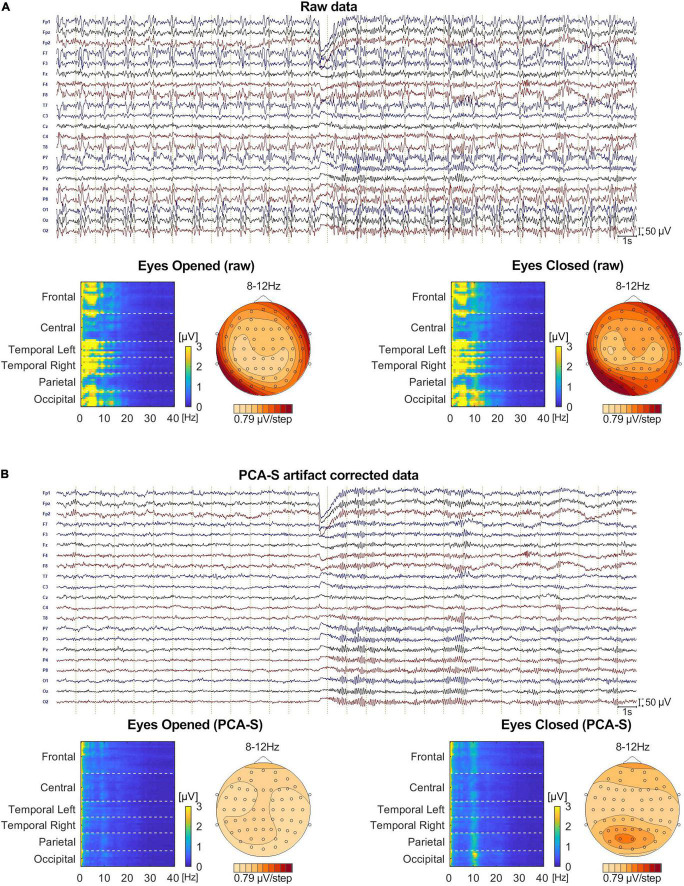
FIGURE 8.
The comparison of Eyes-Opened and Eyes-Closed state for both raw (A) and PCA-S artifact corrected data (B). At the top of each sub-figure an example of the same 30 s of recording is shown, in which the transition from eyes-opened to eyes-closed state occurs in the middle. 20 electrodes are shown (every second channel from the 64-channel montage that was used). Below, an FFT heat map for both states, respectively, is shown, showing each recorded channel (grouped by brain lobes) along with the alpha rhythm topography.

