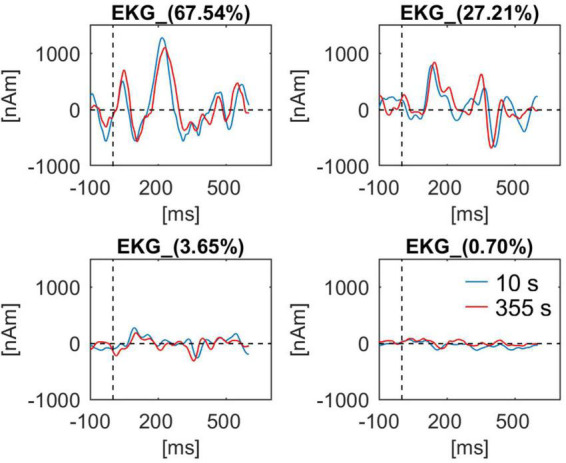
FIGURE 9.

BCG waveforms from a single subject (Berger experiment) for all four artifact components used for artifact correction. Waveforms at the beginning of the recording (10 s, blue line) and at the end of the recording (355 s, red line) are shown. For each component the percentage value of explained variance in the BCG template is indicated in the waveform caption.
