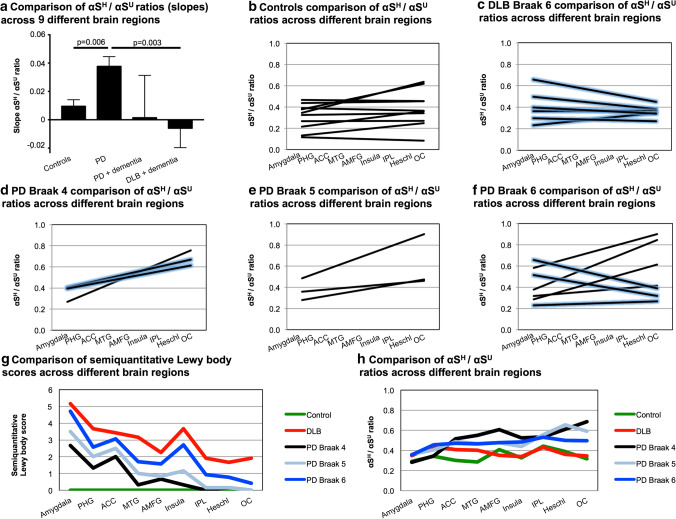
Fig. 4.
αSH/αSU equilibrium is disturbed in PD and DLB patients. For each individual, 9 different brain regions were analyzed, reflecting the temporal development of LB pathology across the limbic and neocortical regions. Amygdala, cortex of the parahippocampal (PHG) and anterior cingulate cortex (ACC) are affected earlier in the disease course, followed by cortex of the insula, middle temporal (MTG), anterior middle frontal gyri (AMFG), and lastly with involvement of the cortex of inferior parietal lobule (IPL). Heschl’s gyrus (Heschl) and cortex of the occipital lobe (OC) are typically spared from LB pathology in PD or involved late in the disease course. Each brain region has been analyzed in biological and technical duplicates and one non-cross-linked control sample. The linear trendlines (slopes) across all nine brain regions is depicted for each individual. a Comparison of αSH/αSU changes across the nine brain regions comparing controls, PD (Braak 4,5 and 6), PD patients with dementia (Braak 4 and 6) and DLB patients (Braak 6) which were all demented. PD patients exhibit significantly increased slopes compared to controls (p = 0.006) and significantly higher slopes than DLB patients (p = 0.003). Mean with standard error of the mean (SEM). b Individual slopes of all controls across the nine brain regions (n = 10). c Individual slopes of all DLB patients across the nine brain regions (n = 6). DLB patients with dementia are displayed in blue enclosed lines. d Individual slopes of PD Braak 4 patients across the nine brain regions (n = 3). PD patients with dementia are displayed in blue enclosed lines. e Individual slopes of all PD Braak 5 patients across the nine brain regions (n = 3). f Individual slopes of PD Braak 6 patients across the nine brain regions (n = 7). PD patients with dementia are displayed in blue enclosed lines. g A semiquantitative LB score demonstrates increased amounts of LBs in later affected brain areas of PD and DLB Braak 6 patients. The mean of the score is displayed (controls n = 10, DLB n = 6, PD n = 13). h Comparison of mean αSH/αSU changes across the nine brain regions comparing controls, PD and DLB patients (controls n = 10, DLB n = 6, PD n = 13). DLB and PD Braak 6 patients exhibit lower slopes (decreased αSH/αSU ratios) in the later affected brain regions

