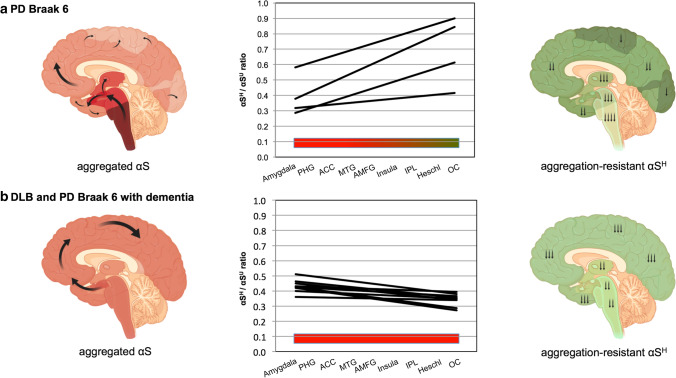
Fig. 5.
Differences of the αSH/αSU equilibriums comparing demented and cognitively intact PD and DLB patients Braak 6. The schematic on the left side depicts the propagation of aggregated αS according to the classical Braak LB stages. For each individual, nine different brain regions were analyzed, reflecting the temporal development of LB pathology across the limbic and neocortical regions. Individual slopes of all patients (PD Braak 6 n = 4, PD and DLB with dementia n = 9) are shown in the middle schematic. The schematic on the right side shows the proposed decreased amount of αSH in the different brain regions

