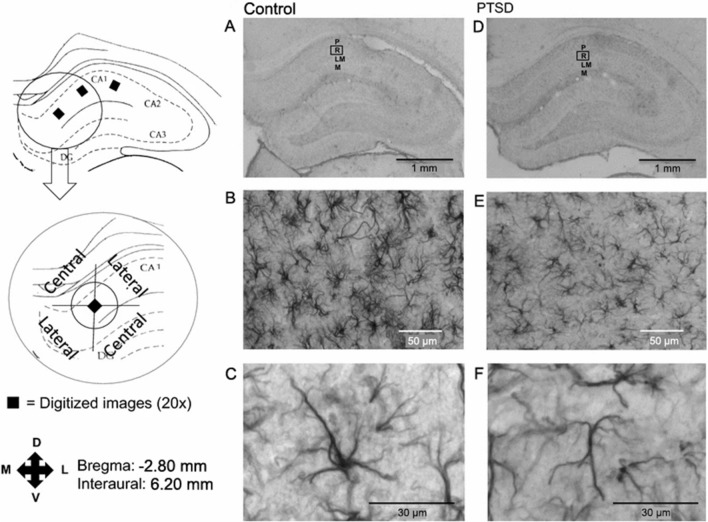
Fig. 2.
Digitized images of the hippocampus after GFAP immunohistochemistry showing the CA1 region. A–C Control; D–F PTSD. A, D Digitized images at 1×; B, E digitized images at 20×; C, F digitized images at 40×. Square areas denote regions of interest at 20×. P, stratum pyramidale; R, stratum radiatum; LM, stratum lacunosum moleculare; M, stratum moleculare. The central and lateral quadrants are defined in relation to the stratum pyramidale.
Reproduced from Saur et al. 2016 [15] with permission from Springer-Nature.

