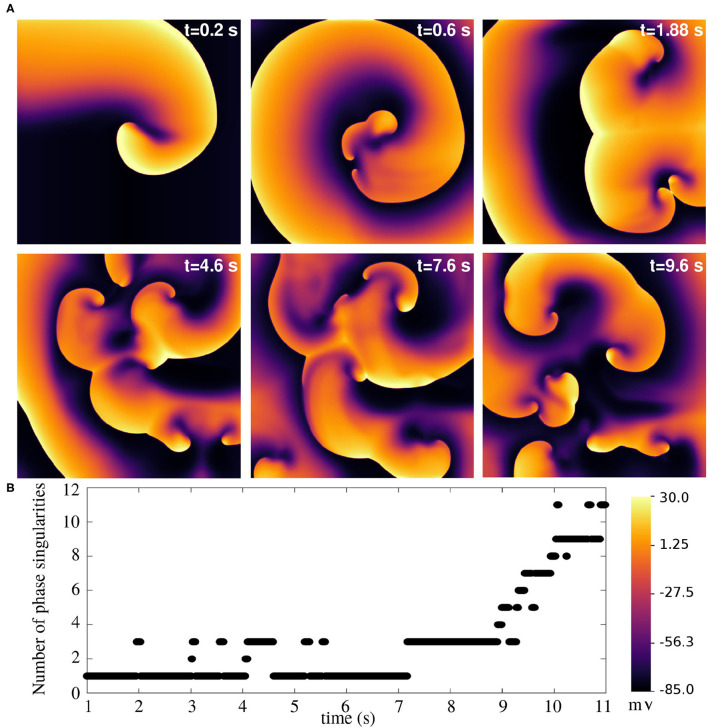
Figure 13.
Spiral wave breakup in a 2D pig atrial tissue of size 11.26 × 11.26 cm2 with GKr, max reduced to 0.25x its value in the healthy pig model. (A) Pseudocolour plots of the membrane voltage distribution at different times demonstrates the occurrence of multiple spiral waves in the domain. (B) Quantification of number of spiral waves in the domain at various times, measured as the number of phase singularities (one located at each spiral tip).

