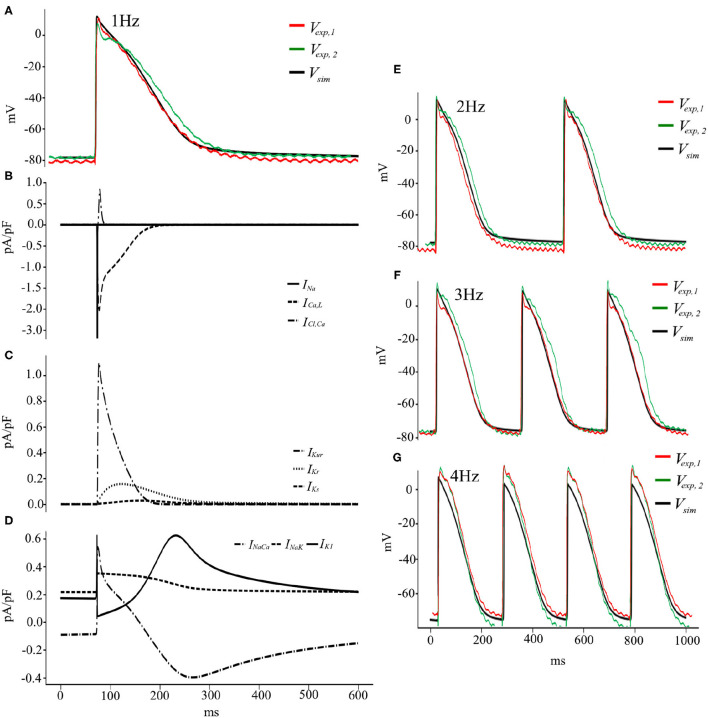
Figure 9.
(A) Voltage and Current traces (B–D) of a pig atrial action potential at 1 Hz pacing. Simulated (solid black) and experimentally measured (green and red) traces of AP recordings from cardiac tissue. (E–G) Voltage traces, both simulated (black) and experimental (green and red), at pacing frequencies of 2, 3, and 4 Hz, respectively.

