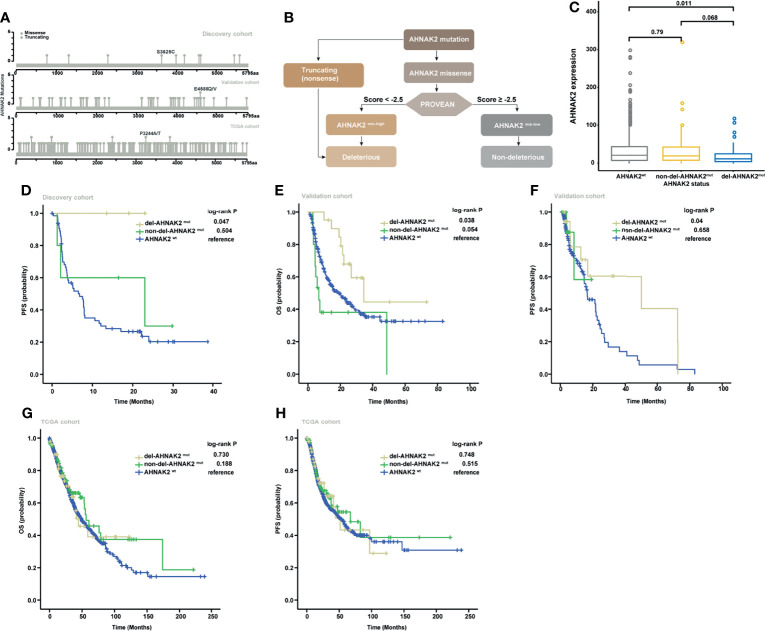
Figure 3.
Validation of the predictive significance of AHNAK2 in pan-cancer. (A) Lollipop plots showing the locus distribution of mutations across the AHNAK2-altered patient cohorts. (B) Flow diagram of the identification of del-AHNAK2mut and non-del-AHNAK2mut by mutational forms and PROVEAN. (C) Kaplan–Meier curves of PFS in the discovery cohort classified by AHNAK2 mutations. (D) Kaplan–Meier curves of OS in the validation cohort classified by AHNAK2 mutations. (E) Kaplan–Meier curves of PFSS in the validation cohort classified by AHNAK2 mutations. (F) Kaplan–Meier curves of OS in the TCGA cohort classified by AHNAK2 mutations. (G) Kaplan–Meier curves of PFS in the TCGA cohort classified by AHNAK2 mutations.

