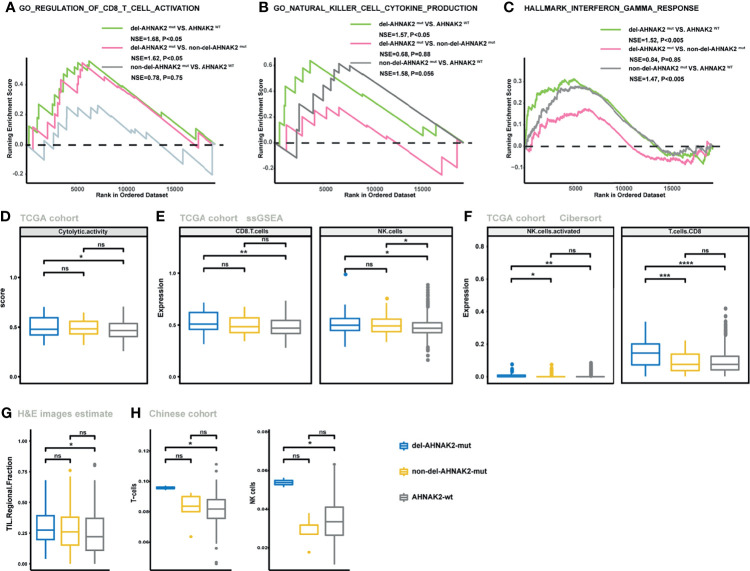
Figure 5.
The mutation status of AHNAK2 was associated with the activated immune microenvironment. (A–C) GSEA of signatures related to CD8 T cell activation (A), NK cell activation (B), and IFN-γ (C) in comparisons between NSCLC samples with del-AHNAK2 mut, non-del-AHNAK2 mut, and no AHNAK2 mutation. (D) Comparison of the cytolytic activity score between AHNAK2 wt, del-AHNAK2 mut, and non-del-AHNAK2 mut tumors by the ssGSEA method based on TCGA RNA-sequencing data. (E) Comparison of the infiltration degree of immune cells by the ssGSEA method based on RNA-sequencing data between AHNAK2 wt, del-AHNAK2 mut, and non-del-AHNAK2 mut tumors. (F) Comparison of the infiltration degree of immune cells by the CIBERSORT analysis. (G) Comparison of the TIL regional fractions based on estimates from processing diagnostic H&E images between AHNAK2 wt, del-AHNAK2 mut, and non-del-AHNAK2 mut tumors. (H) Comparison of the infiltration degree of immune cells in the Chinese NSCLC cohort. (Mann–Whitney U test; ns, not significant; *p < 0.05, **p < 0.01, ***p < 0.001, ****p < 0.0001)

