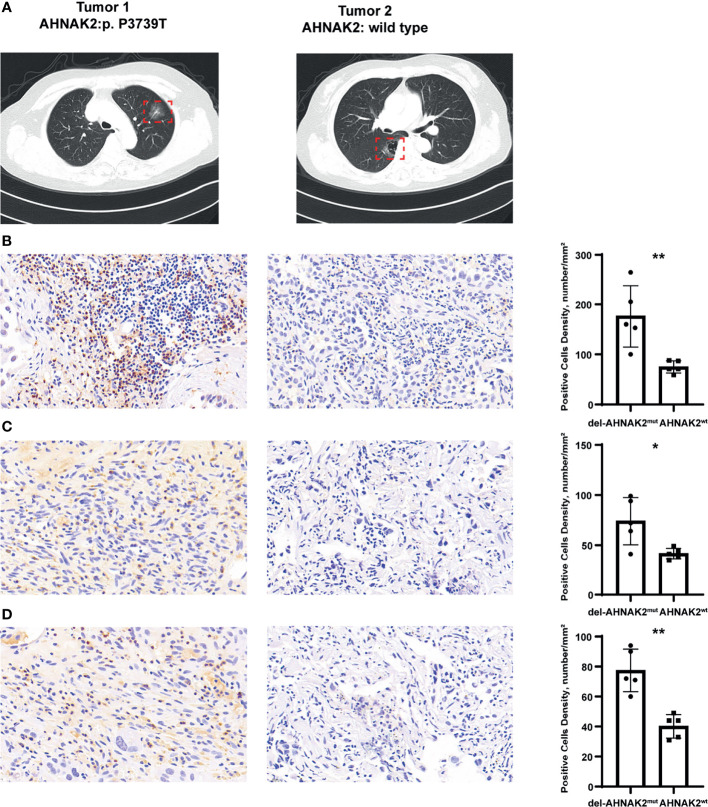
Figure 6.
Immunohistochemical staining to evaluate the association between del-AHNAK2 mut and activated immune microenvironment. (A) Computed tomography (CT) imaging of the representative MPLC patient. (B–D) Quantitative immunohistochemistry (IHC) analysis of CD3 (B), GZMB (C), and IFNG (D) protein expression in the del-AHNAK2 mut and AHNAK2 wt groups (n = 5/group). Representative micrographs of these samples are shown. Data represent the mean ± SD. (Mann–Whitney U test; *p < 0.05, **p < 0.01).

