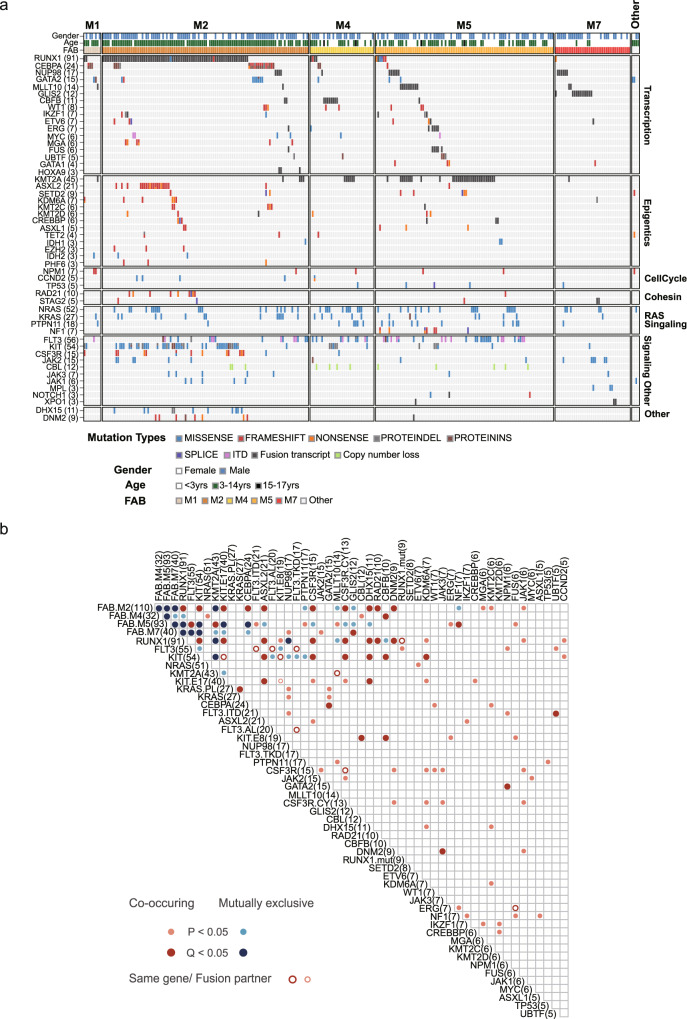
Fig. 3. Landscape and correlation of driver genes in Chinese AML.
a Heat-map displays genes mutated in ≥3 AML cases. Cases are separated into FAB groups (columns), and the genes are grouped into six biological pathways (rows). Colors represent mutation types. b Pairwise co-occurrence (red) and mutual exclusive (blue) correlations between driver genes (two-sided Fisher’s exact test). The correlations are labeled with hollow circle if the pairs of mutations/genes were from a same gene or fusion.

