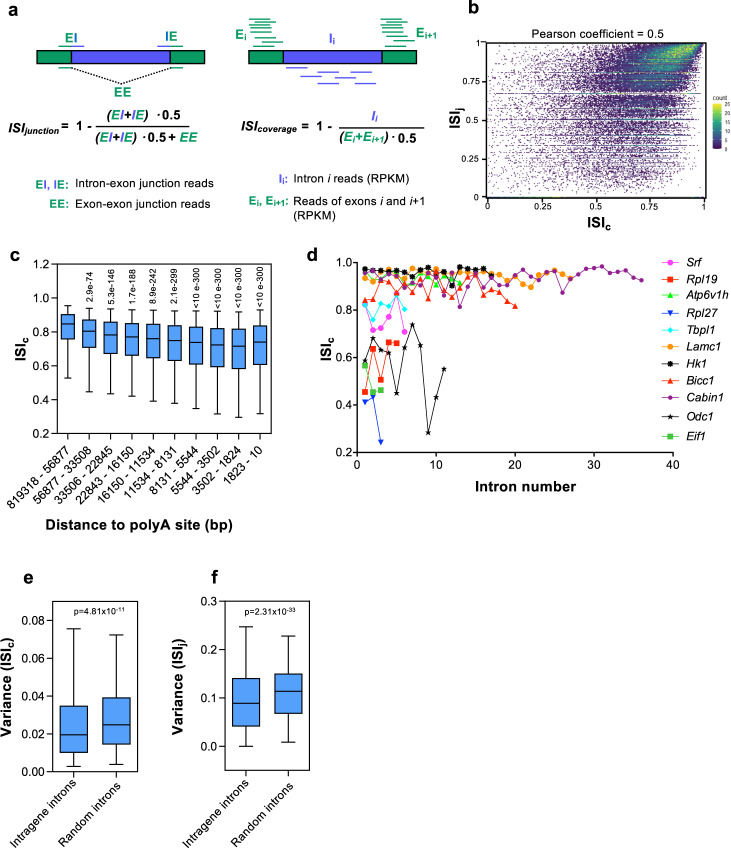
Fig. 1. Intron splicing efficiency.
a Schematics outlining the two approaches used to measure the intron splicing index (ISI): junction-based ISI (ISIj) and coverage-based ISI (ISIc). RPKM, reads per kilobase per million mapped reads. b Scatter plot of ISIj and ISIc values correlation. Each point represents the ISIj and ISIc of a certain intron. c Effect of intron to polyA site distance on ISIc. Introns were divided into ten deciles depending on their distance to the polyA site. Unpaired Student’s t-test p-values of the indicated decile with respect to the first decile are shown. d ISIc level of the indicated introns of eleven different genes. e, f Variance of ISIc (e) and ISIj (f) values across introns within the same gene or the same number of randomly sampled introns. Unpaired Student’s t-test p-values are shown. Sample size (n) of all sets of data are provided in Supplementary Data 4.

