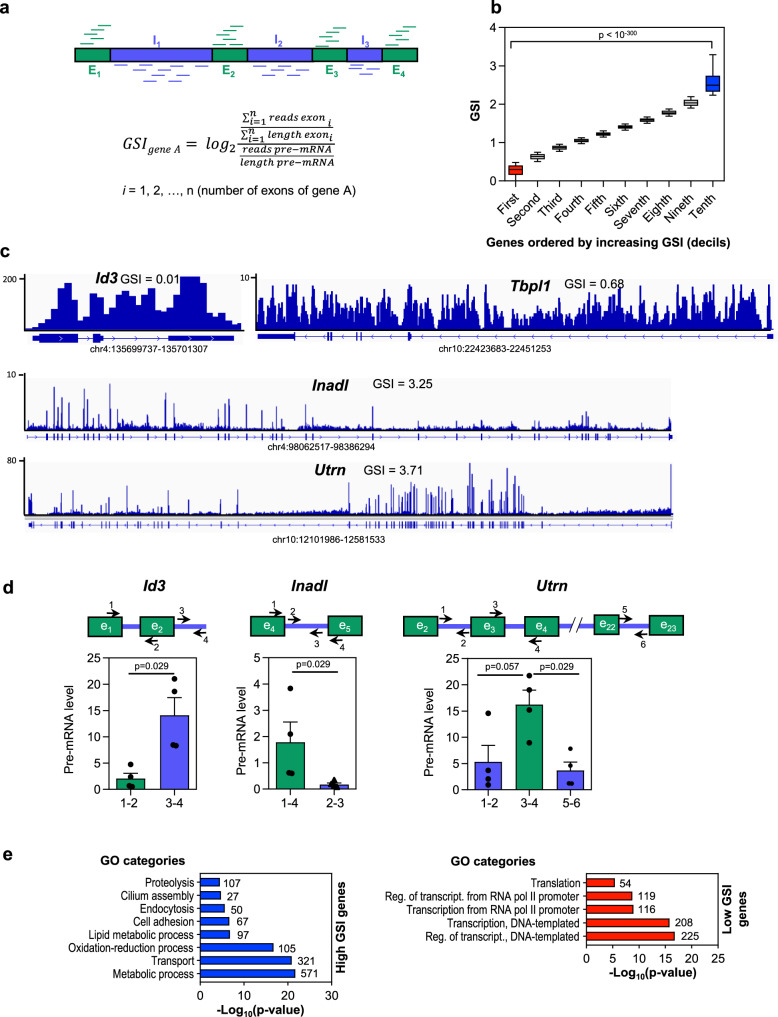
Fig. 2. Gene splicing efficiency.
a Schematics outlining the approach used to measure the Gene Splicing Index (GSI). RPKM, reads per kilobase per million mapped reads. b GSI values ordered from low to high GSI and binned into ten deciles. Low-GSI genes (i.e., genes in the first decile) are indicated in red, and high-GSI genes (i.e., genes in the last decile), in blue. Student’s t-test p-values of the indicated comparison are shown. c Chromatin-associated RNA-seq (ChrRNA-seq) IGV snapshots are shown for genes with a low GSI (Id3 and Tbpl1) or a high GSI (Inadl and Utrn). d RT-qPCR determination of intronic and exonic levels of one low-GSI gene (Id3) and two high-GSI genes (Inadl and Utrn) using chromatin-associated RNA. Represented values are mean ± SEM of four (n = 4) independent biological replicates. Unpaired two-tailed Mann–Whitney p-values of the indicated comparison are provided. e Functional analysis using Gene Ontology (GO) of high-GSI genes and low-GSI genes. Number of genes in each category is shown. Sample size (n) of all sets of data are provided in Supplementary Data 4.

