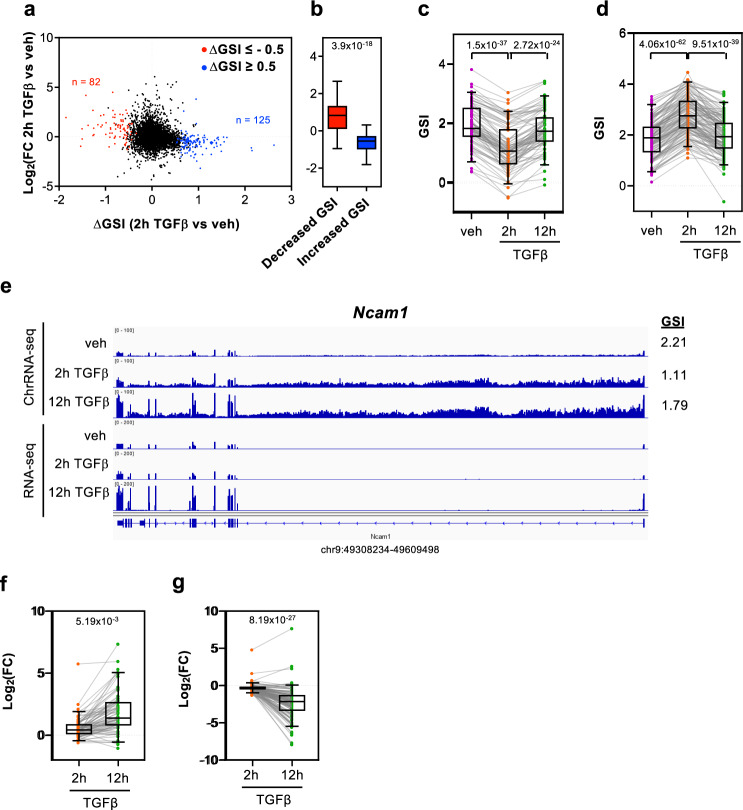
Fig. 4. Change of GSI (∆GSI) after 2 h of TGFβ treatment.
a Scatter plot of nascent pre-mRNA level changes (log2FC) versus GSI changes (∆GSI) after 2 h of TGFβ treatment. Genes with decreased GSI (∆GSI < –0.5, p < 0.05) or increased GSI (∆GSI > 0.5, p < 0.05) are depicted in red or blue, respectively. b Boxplot of nascent pre-mRNA level changes (log2FC) after 2 h of TGFβ treatment versus vehicle, for genes with decreased or increased GSI values. Unpaired Student’s t-test p-values are shown. c, d GSI levels at the three conditions tested (vehicle, 2 and 12 h of TGFβ treatment) for genes with decreased GSI (c) or increased GSI (d) after 2 h of TGFβ treatment. e ChrRNA-seq and RNA-seq IGV snapshot of Ncam1 gene as example of a transient change of GSI after 2 h of TGFβ. f, g Changes of mature mRNAs level (log2FC) after 2 h or 12 h of TGFβ of genes with decreased (f) or increased GSI (g) at the 2 h TGFβ time point. c, d, f, g Paired Student’s t-test p-values of the comparison between the indicated distributions are shown. Sample size (n) of all set of data are provided in Supplementary Data 4.

