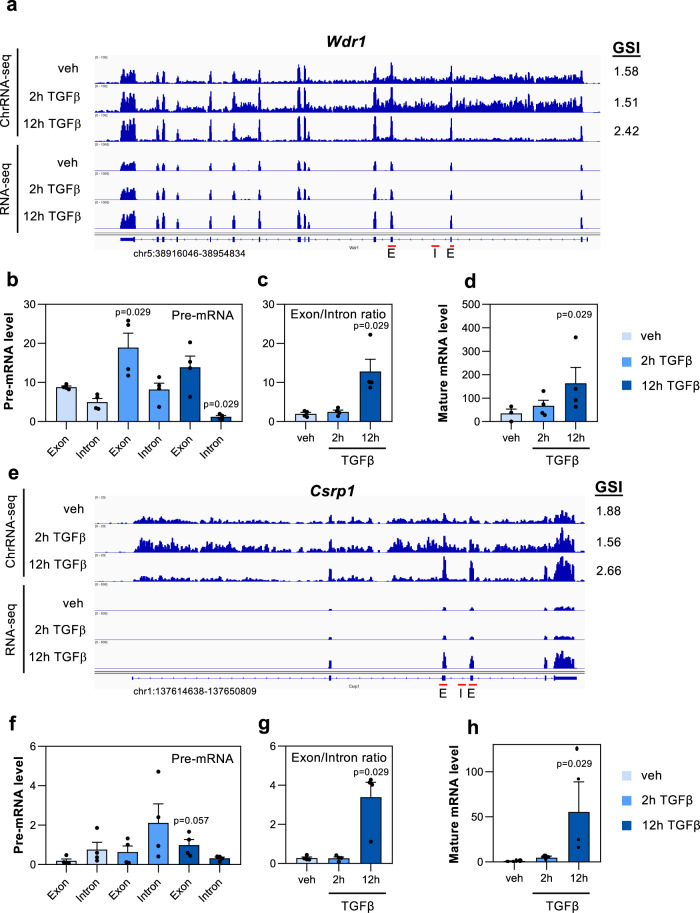
Fig. 6. Effects on gene expression of GSI changes after 12 h of TGFβ addition.
a, e ChrRNA-seq and RNA-seq IGV snapshot of Wdr1 (a) and Csrp1 (e) genes in vehicle or at 2 or 12 h after TGFβ treatment. b, f Exon and intron levels of Wdr1 (b) and Csrp1 (f) transcripts in nascent chromatin-associated RNA isolated at the three conditions tested: vehicle or at 2 h or 12 h after TGFβ. Levels were determined by RT-qPCR, using exon–exon or exon–intron amplicons (oligonucleotides indicated as red arrows). c, g Exon/intron ratios for Wdr1 or Csrp1 transcripts using data shown in b, f, respectively. d, h Mature mRNA levels of Wdr1 and Csrp1 genes at the three conditions tested: vehicle (control) or at 2 h or 12 h after TGFβ addition determined by RT-qPCR using RNA from the cytoplasmic fraction and exon–exon oligonucleotides (indicated as red arrows). b–d, f–h Values represent the mean ± SEM of four (n = 4) independent biological replicates. Unpaired two-tailed Mann–Whitney p-values of the indicated comparison are shown. Sample size (n) of all set of data are provided in Supplementary Data 4.

