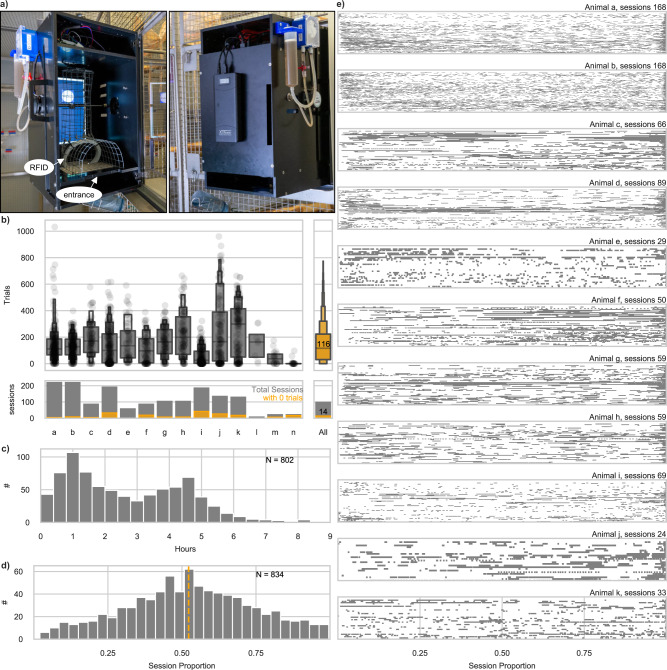
Fig. 1. General engagement on the MXBI across all autonomous experiments.
a MXBI device attached to a cage in the animal facility. Left—opened for experimenter access to the inside of the device, Right—closed. b Letter-value plots of the number of trials performed in each session, dark gray: for each animal individually, orange: average distribution with all animals considered. The central box defines the median and 25th up to 75th percentile. Successively narrower boxes are drawn between the 1/8*100th and 7/8*100th, the 1/16th and 15/16*100th, and so on percentile. The total number of trials per animal can be found in Table 1. The number of sessions per animal and the average across animals are plotted below. Sessions without a single trial performed are given in orange. c Distribution of the duration of all sessions. d Distribution of all median timestamps as a function of session proportion. The dashed orange line indicates that across sessions half of the trials were performed within 52% of the session duration. e For each of the animals with more than 3000 trials, each trial of each session with more than 10 interactions (shared ordinated) is plotted with respect to its timestamp normalized by the session duration.

