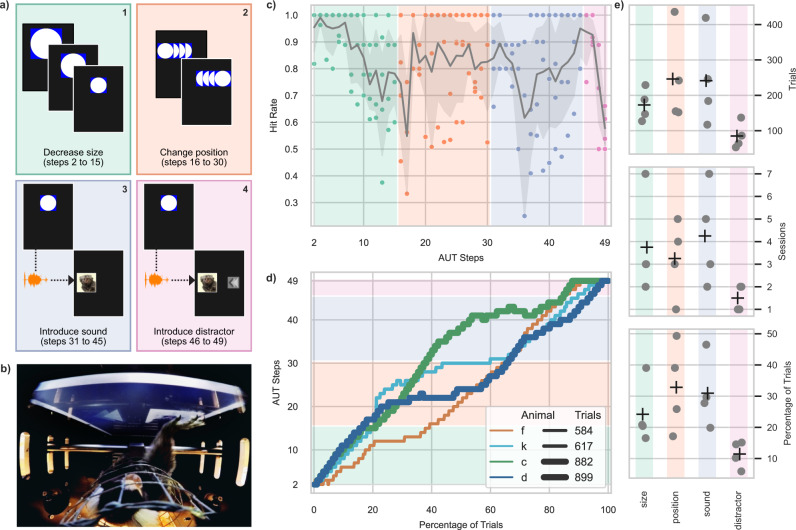
Fig. 2. Automated unsupervised training (AUT) performance across four representative animals.
a Schematics of the four main milestones of the final AUT protocol. b Picture taken with an external high-resolution wide-angle camera, where an animal can be seen completing a trial. c Average hit rate as a function of steps (gray area represents the 95% confidence interval of the mean across animals) across the four animals considered in this analysis. d Percentage of trials spent on each AUT step and milestones (shaded background) with line thickness indicating the total amount of trials performed by the corresponding animal. e Distributions of number of trials, number of sessions, and percentage of total trials for each milestone across the four naïve animals (crosses represent average values).

