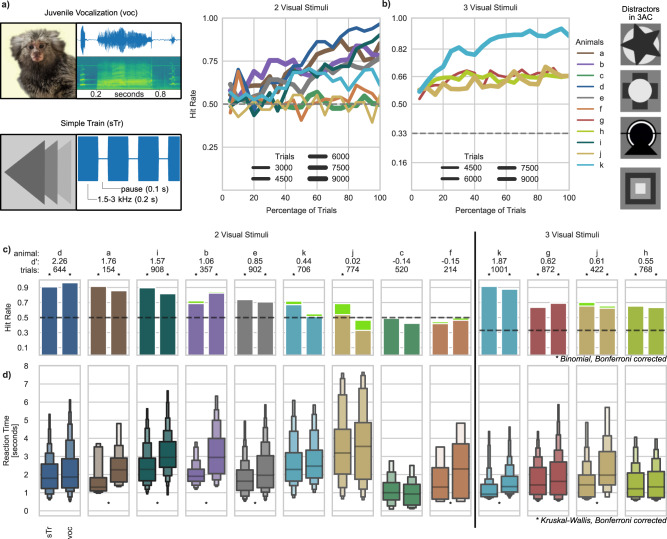
Fig. 3. Stimuli and results from the Audio-visual association experiment.
a, b Visual and acoustic stimuli combinations used and hit rate as a function of percentage of trials performed, for different animals (colored lines) and across tasks. Hit rate, as a function of the percentage of trials performed by each animal, is grouped into bins of 5%. Line thickness represents the number of trials of each animal in each panel. Dashed lines at 0.5 and 0.33 represent the chance level for the two tasks. c Hit rate across the last 5 sessions as a function of stimulus type (“sTr” for the pure tone stimulus, “voc.” for the juvenile vocalization; green bars indicate ignored trials), with corresponding number of trials and sensitivity index (d’). Stars represent significance reached for the given stimulus at a Bonferroni post-hoc corrected Binomial test (one-sided test). d Letter-value plots of the reaction times plotted for each stimulus type separately. The central box defines the median and 25th up to 75th percentile. Successively narrower boxes are drawn between the 1/8*100th and 7/8*100th, the 1/16*100th and 15/16*100th, and so on, percentile. Stars represent significant statistical difference in reaction times between the two stimuli at a Bonferroni post-hoc corrected Kruskal–Wallis Test (one-sided test). Statistics and N number for panels (c) and (d) are given in Table 2.

