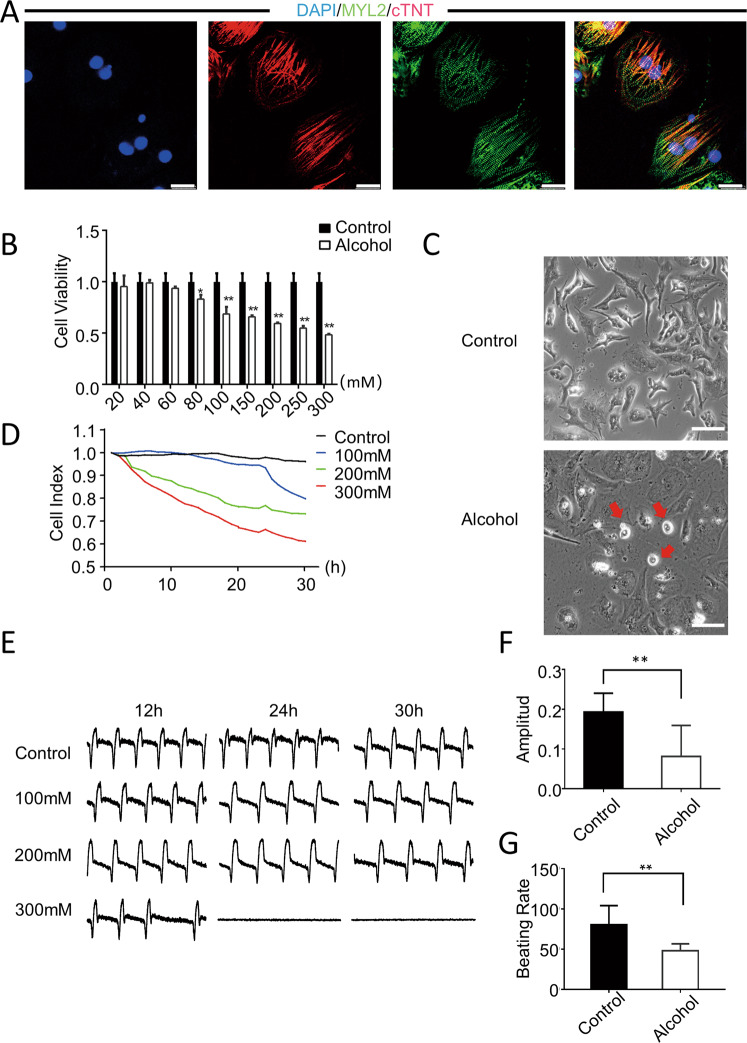
Fig. 1. Modeling alcoholic cardiomyopathy using hiPSC-CMs.
A Representative immunostaining for the expression of MYL2 (green) and cTNT (red) in hiPSC-CMs. Scale bar = 50 μm. B CCK-8 assay showed that the cell viability decreased to 95.3, 98.9, 93.6, 83.1, 68.5, 59.4, 54.8, and 48.3% after treatment with different concentrations of alcohol (i.e., 20, 40, 60, 80, 100, 150, 200, 250, and 300 mM) for 24 h (n = 4). C Representative images showed that hiPSC-CMs shrink and became round after alcohol treatment. Scale bar = 200 μm. D RTCA was used to monitor the changes in cell index after treating hiPSC-CMs with different concentrations of alcohol (i.e., 100, 200, and 300 mM) for 30 h (n = 30). E–G Changes in vibration amplitude and beat frequency over a 30-h period [F(n = 39); G(n = 41)]. Results are presented as means ± standard error of the mean (*P < 0.05, **P < 0.01, ***P < 0.001; two-sided Student’s t-test or one-way analysis of variance).

