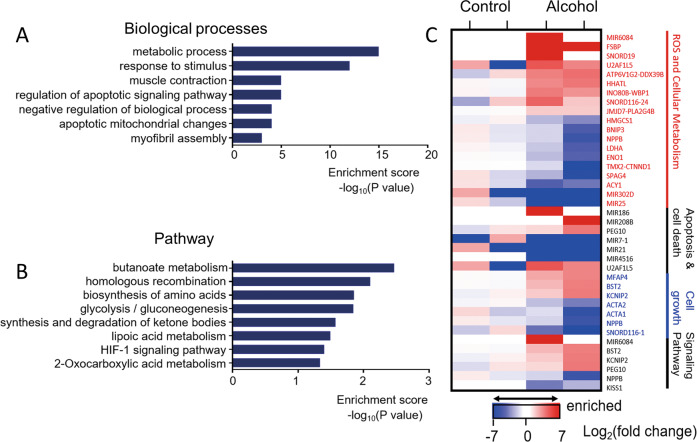
Fig. 3. Alcohol-induced changes in the global gene expression profiles of cardiomyocytes.
A The enriched terms GO (correlated P value of ≤0.05) of 100 mM alcohol treatment compared with vehicle. B The pathway analysis between the control and hiPSC-CMs treated with 100 mM alcohol is listed (P value of ≤0.05). C The heatmap of 39 differentially expressed RNAs between the 100 mM alcohol group and hiPSC-CMs showing four functional clusters. Each row corresponds to a single differentially expressed gene. Colors ranging from blue to red represent the relative expression levels (Log2(fold change)) of RNAs.

