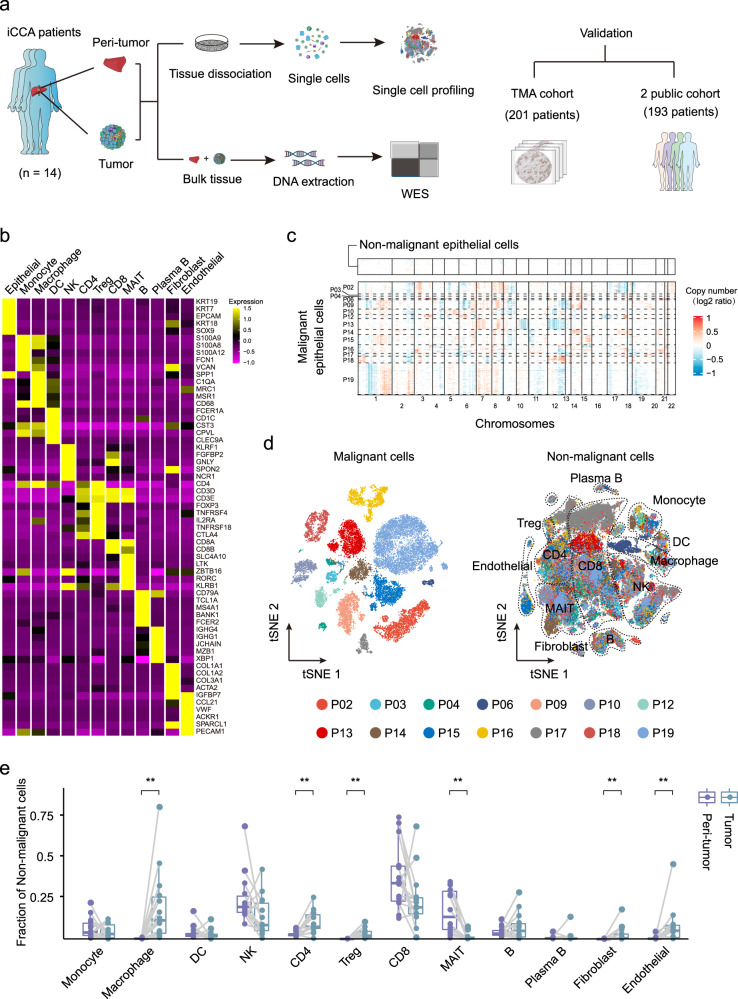
Fig. 1. ScRNA-seq profiling of 14 iCCAs.
a Schematic representation of the experimental strategy. WES whole-exome sequencing, TMA tissue microarray. Part of the picture was adapted from motifolio.com. b Heatmap showing the expression of marker genes in the indicated cell types. c Chromosomal landscape of inferred large-scale copy number variations (CNVs) in nonmalignant epithelial cells (top) and malignant cells from 14 iCCA samples. Rows represent individual cells and columns represent chromosomal positions. Amplifications (red) or deletions (blue) were inferred by averaging expression over 100-gene stretches on the respective chromosomes. d t-SNE plot of malignant and nonmalignant cells from 14 iCCAs. e Boxplot showing the fraction of nonmalignant cells in peri-tumor and tumor. (Peri-tumor n = 14, Tumor n = 14; **P < 0.01; two-sided Wilcoxon matched-pairs signed-rank test; Macrophage: P = 0.00012; CD4: P = 0.0012; Treg: P = 0.00012; MAIT: P = 0.00012; Fibroblast: P = 0.0017; Endothelial: P = 0.0012). The central mark indicates the median, and the bottom and top edges of the box indicate the first and third quartiles, respectively. The top and bottom whiskers extend the boxes to a maximum of 1.5 times the interquartile range. Source data are provided as a Source Data file.

