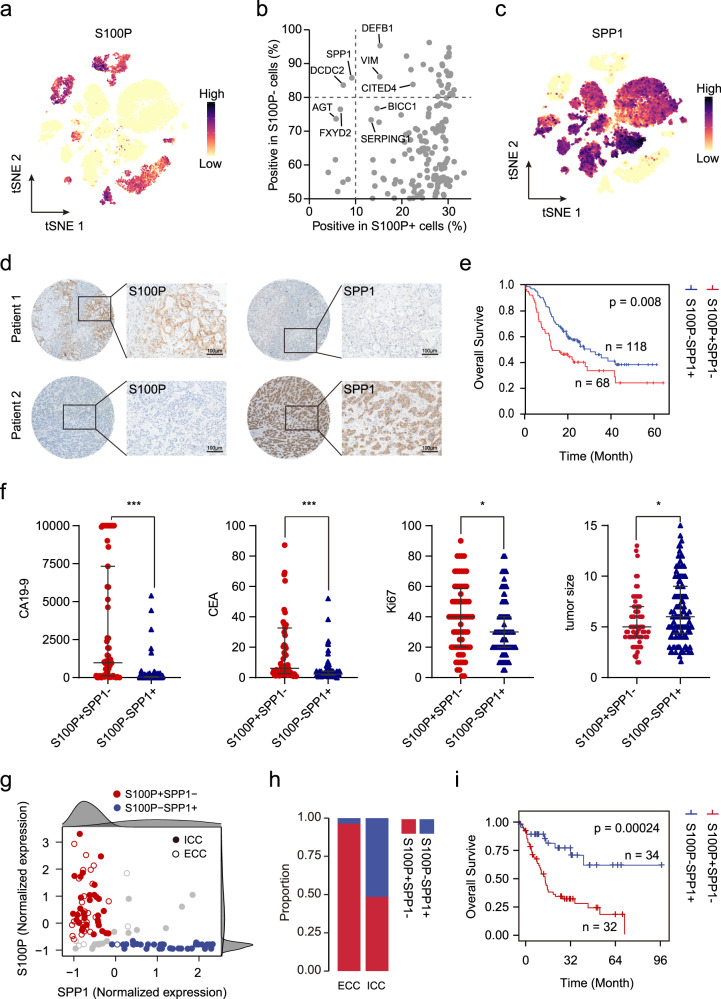
Fig. 2. iCCA can be classified into two subtypes according to the expression of S100P and SPP1.
a t-SNE plot showing the expression level of S100P in malignant cells. b Proportion of positive cells with gene expression in S100P + (x-axis) and S100P- cells (y-axis). c t-SNE plot showing the expression level of SPP1 in malignant cells. d Representative images of immunohistochemical expression of S100P and SPP1 in iCCAs from TMA cohort (n = 201). Patient 1: S100P + SPP1−, Patient 2: S100P-SPP1+. Scale bar, 100 μm. The experiment was repeated once with similar results. e Kaplan–Meier plot of the S100P + SPP1− and S100P-SPP1+ based on TMA data. Two-sided log-rank test. f The scatter diagrams showing the differences in carbohydrate antigen 19-9 (CA19-9, S100P + SPP1− n = 63, S100P-SPP1 + n = 114), carcinoembryonic antigen, (CEA, S100P + SPP1 − n = 63, S100P − SPP1 + n = 115), Ki67 (S100P + SPP1− n = 68, S100P−SPP1 + n = 118), and tumor size (S100P + SPP1− n = 68, S100P-SPP1 + n = 118) between the two groups (*P < 0.05; ***P < 0.001; two-sided Mann–Whitney U-test; CA19-9: P < 0.0001; CEA: P < 0.0001; Ki67: P = 0.025; tumor size: P = 0.019). Data were presented as median with interquartile range. g Scatterplot of S100P and SPP1 expression in Jusakul et al. dataset20. A Gaussian mixture model with two mixture components was used to identify S100P +/− and SPP1 +/− patients (right and top distribution curves). Solid circles represent iCCA and open circles represent extrahepatic cholangiocarcinoma (ECC). Red represents S100P + SPP1- while blue represents S100P-SPP1+. h Graphical representation of the proportion of S100P + SPP1- and S100P-SPP1+ in iCCA and ECC. i Kaplan–Meier plot of the S100P + SPP1− and S100P-SPP1+ based on Jusakul et al. dataset20. Two-sided log-rank test. Source data are provided as a Source Data file.

