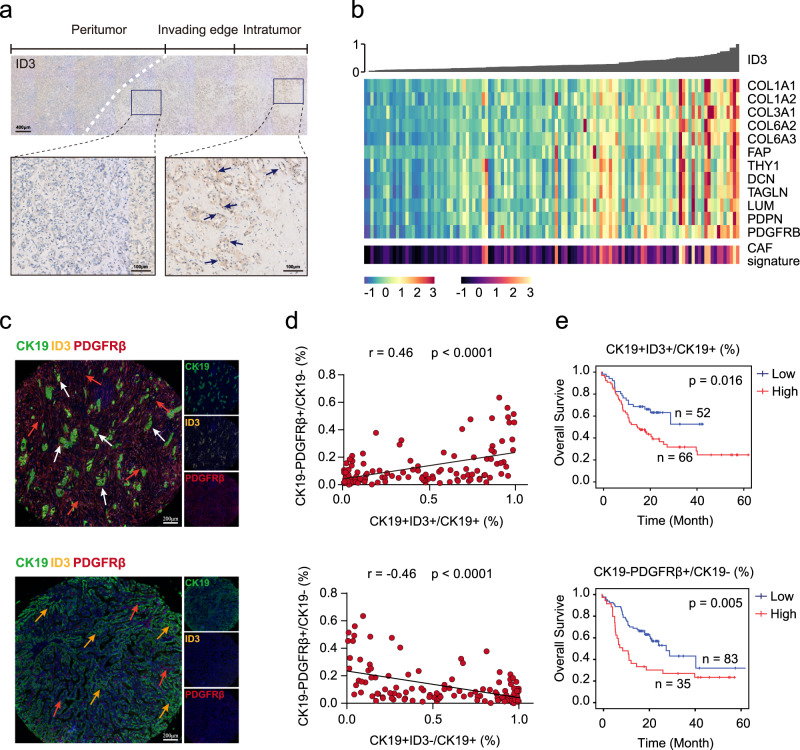
Fig. 6. Prognostic significance of CK19 + ID3 + tumor cells in S100P-SPP1 + iCCAs.
a Representative immunostaining of ID3 in the indicated S100P-SPP1 + iCCAs. ID3 + tumor cells were predominantly located in the intratumor region. Scale bar, 400 μm (up) and 100 μm (down). Images were collected from 17 additional iCCA slides that contained both tumor and corresponding paracancerous tissues. The experiment was repeated once with similar results. b Correlation between ID3 expression and CAFs. iCCA from Jusakul et al.’s dataset20 were ordered by their ID3 expression level as shown by bar plot (top). Heatmap (middle) showing expression levels of selected CAF markers (rows) for each tumor (columns). Colored bar (bottom) showing the CAFs score estimated by MCP-Counter of each tumor. c Representative mIHC images showing the distribution of CK19 + ID3 + , CK19 + ID3- tumor cells and CK19-PDGFRβ + cells in S100P-SPP1 + iCCA (n = 118) from TMA cohort: CK19 (green), ID3 (yellow), PDGFRβ (red), and DAPI (blue). White arrows (CK19 + ID3 + ), yellow arrows (CK19 + ID3−), red arrows (CK19-PDGFRβ+). The experiment was repeated once with similar results. Scale bar, 200 μm. d Correlation analysis between the proportion of CK19 + ID3 + (up) and CK19 + ID3- (down) within CK19 + tumor cells and the proportion of CK19-PDGFRβ + cells within CK19− cells per core, respectively. (Two-sided spearman correlation coefficient). e Kaplan–Meier analysis of overall survival (OS) in S100P-SPP1 + iCCA tumors according to the proportion of CK19 + ID3 + within CK19+ tumor cells (up) and CK19-PDGFRβ + within CK19− cells (down) in the TMA cohort. Two-sided log-rank test. Source data are provided as a Source Data file.

