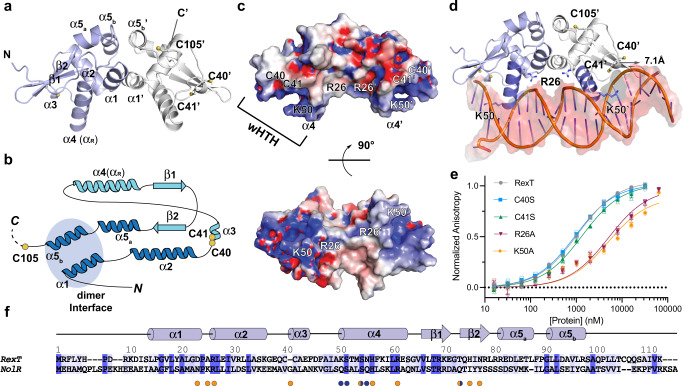
Fig. 2. RexT has an ArsR-SmtB-type winged helix-turn-helix fold.
a The crystal structure of RexT reveals that it is a homodimer. Each protomer of RexT has an α1-α2-α3-α4-β1-β2-α5a/b architecture. Chains A and B are colored in light blue and light gray, respectively. Two of the three potential redox sensing Cys residues are located on the α3 helix (Cys40 and Cys41). Due to the dynamic nature of the residues following Cys105 in chain B, residues 106–112, like residues 102–112 in chain A were unable to be included in the final model of RexT. b A topology diagram of RexT shows the position of the three Cys residues (yellow circles), the dimeric interface (blue circle), and the wHTH motif (light blue secondary structure). c The calculated electrostatic potential of RexT reveals positively charged patches. The two-Cys residues and two positively charged residues that are proposed to be involved in DNA-binding are highlighted. d RexT is shown overlaid with a DNA-bound NolR structure32 (PDB: 4ON0, RexT is shown with DNA from the NolR structure following an alignment performed in PyMol). This overlay reveals potential residues involved in interacting with DNA and showcases that a complementary interaction can be formed between the positively charged region of RexT and the negative backbone of DNA. In each monomer, αR is colored in dark purple. e A labeled DNA probe shows changes in fluorescence anisotropy following the addition of RexT. These differences allowed for the calculation of the DNA binding affinity of wild-type RexT and the different variants used in this work (Supplementary Table 2). Compared to wild-type RexT (gray, Kd = 1.08 ± 0.07 µM), the K50A (orange, Kd = 5.29 ± 1.86 µM) and R26A (red, Kd = 5.18 ± 1.22 µM) RexT variants show decreased DNA binding affinity whereas the C40S (blue) and C41S (green) variants don’t have any significant change. f A sequence alignment of RexT with NolR shows a conserved DNA-binding architecture and key residues. The sequences are aligned by Clustal W.89 and colored by Jalview90 based on the percent identity with dark blue indicating sequence identity. DNA binding residues in NolR are indicated by orange (interaction with DNA backbone phosphate) and blue (base-specific interaction) dots. The alignment is annotated based on the secondary structure and residue numbers of RexT. In e, data was measured using n = 3 independent experiments and is presented with the individual measurements (open shapes) and as the mean value of these measurements ± SD (closed shapes). Source data are provided as a Source Data file.

