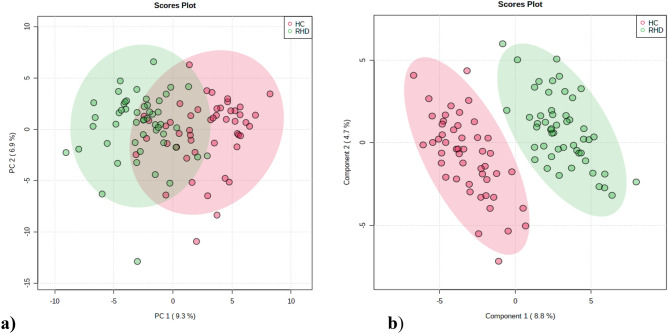
Figure 1.
Chemometric analysis of metabolites among RHD and healthy controls. (a) Principal Component Analysis (PCA) score plot from RHD and healthy control. The green dots represent RHD patients and the red dots represent healthy controls in the 2D PCA score plots. (b) Partial least squares discriminant analysis (PLS-DA) score plot from RHD and healthy control. The two groups are well separated in the PLS-DA score plot, indicating that they had markedly different metabolic characteristics.

