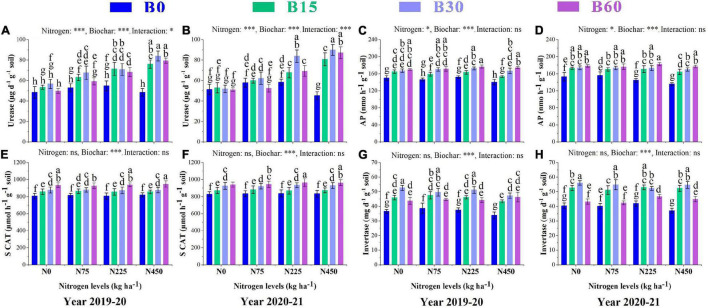
FIGURE 1.
Integral effects of biochar and nitrogen on soil urease (A) 2019–2020, (B) 2020–2021, alkaline phosphatase (C) 2019–2020, (D) 2020–2021, soil catalase (E) 2019–2020, (F) 2020–2021 and invertase (G) 2019–2020 and (H) 2020–2021. B0: 0 t ha−1biochar; B15: 15 t ha−1biochar; B30: 30 t ha−1biochar; B60: 60 t ha−1biochar; N0: 0 kg ha−1 nitrogen; N75: 75 kg ha−1 nitrogen; N225: 225 kg ha−1 nitrogen, and N450: 450 kg ha−1 nitrogen, error bars represent standard error for each treatment in three replicates. Different letters on each bar represent significant difference according to LSD test (p < 0.05).

