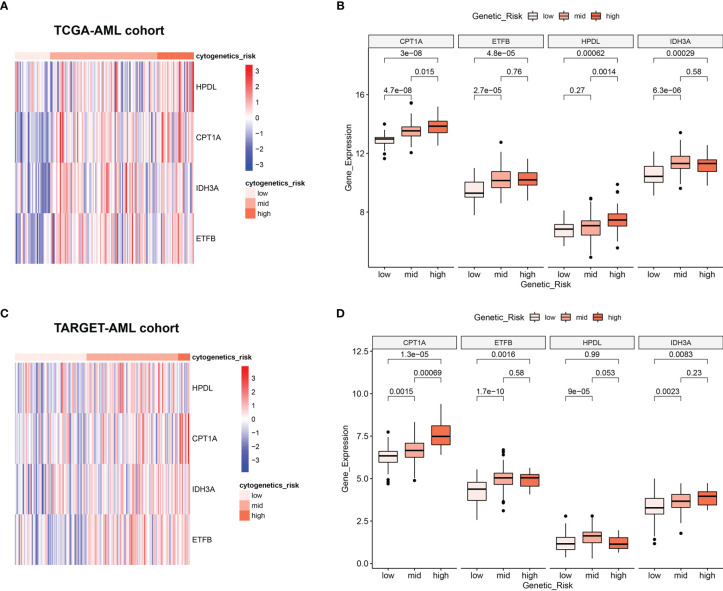
Figure 4.
Relationship between 4 MRGs’ expression and cytogenetic risk in AML. (A) The heatmap of 4 MRGs in different risk stratification in TCGA-AML. (B) The boxplot of the 4 MRGs in different risk stratification in TCGA-AML. (C) The heatmap of 4 MRGs in different risk stratification in TARGET-AML. (D) The boxplot of the 4 MRGs in different risk stratification in TARGET-AML cohort. AML, acute myeloid leukemia.

