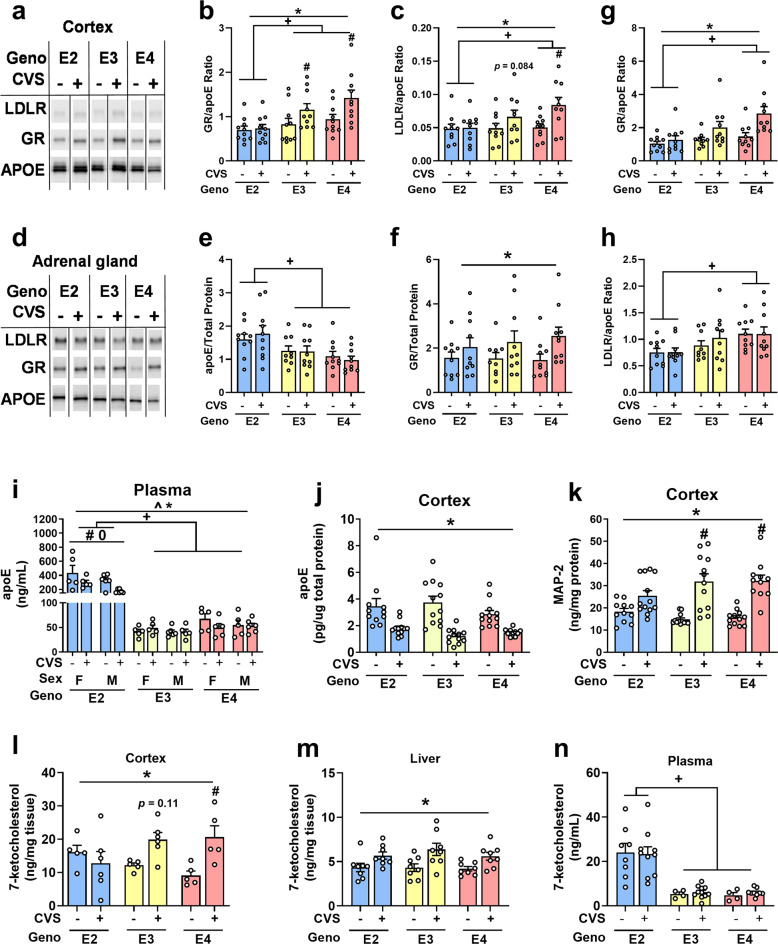
Fig. 4. Protein and lipid measurements in tissue and plasma.
a Example cortex Western blot. b E2 mice had the lowest GR/APOE ratio (+p < 0.05) and E3 and E4 CVS-exposed mice showed larger ratios compared to controls (#p < 0.05). c LDLR/apoE ratios had similar differences to the GR/apoE ratios (+p < 0.05, #p < 0.05). d Example adrenal gland Western blot. e E2 mice had the highest apoE levels in adrenal glands (+p < 0.05). f GR in the adrenal gland was higher in CVS-exposed mice (*p < 0.05). g GR/apoE ratios were lowest in E2 mice (+p < 0.05). CVS-exposure resulted in higher GR/apoE ratio compared to controls (*p < 0.05). h E2 mice had the lowest LDLR/apoE ratios (+p < 0.05). i Plasma levels of apoE were highest in E2 mice (+p < 0.05). Furthermore, E2 mice exposed to CVS had lower apoE levels compared to controls (*p < 0.05). Female E2 mice had more plasma apoE than male E2 mice (0p < 0.05). j In cortical tissue, CVS exposure led to lower apoE levels (*p < 0.05). k Meanwhile, MAP-2 levels in the cortex were higher in mice exposed to CVS (*p < 0.05). l Female cortical tissue showed a genotype x group interaction in which only E4 mice exposed to CVS showed higher levels of 7-ketocholesterol compared to controls (#p < 0.05). m CVS exposure was associated with higher 7-ketocholesterol levels (*p < 0.05) regardless of genotype or sex (shown collapsed). n Plasma levels were highest in E2 mice (+p < 0.05, shown with sexes collapsed). Symbols: + refers to pairwise comparison of genotype effect, * refers to CVS effect, ^ refers to sex effect, # refers to genotype x CVS interaction, 0 refers to sex x genotype interaction.

