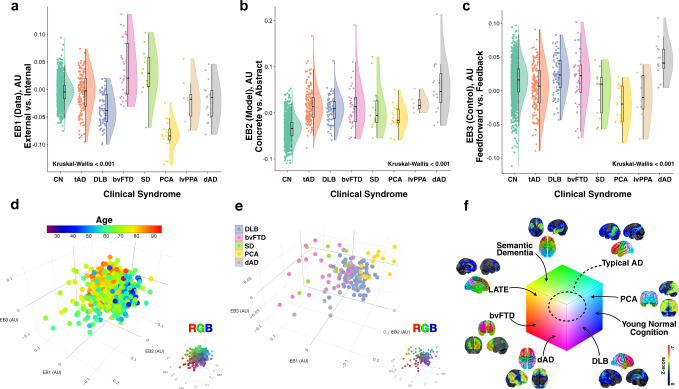
Fig. 4. Glucose eigenbrains across normal aging and seven clinical dementia syndromes.
Rain cloud plots61 with data distribution and jittered raw data points for biologically independent unique patient observations on either side of boxplots (horizontal lines denote median values; boxes extend from the 25th to the 75th percentile of each group’s distribution of values; vertical extending lines denote values within 1.5 interquartile range of the 25th and 75th percentile of each group) of eigenvalues for a EB1, b EB2, and c EB3 for cognitively normal amyloid negative individuals across the aging spectrum (CN, n = 1121), typical AD (tAD, n = 137), dementia with Lewy bodies (DLB, n = 72), behavioral variant of frontotemporal dementia (bvFTD, n = 33), sematic dementia (SD, n = 11), posterior cortical atrophy (PCA, n = 15), logopenic variant of primary progressive aphasia (lvPPA, n = 8), and dysexecutive AD (dAD, n = 15). Source data are provided as a Source Data file. d Scatter plot for the first 3 EBs for all these subjects with age color mapping showing the youngest individuals (blue) at the opposite extreme from the oldest individuals (red). The same plot with RGB color mapping for reference to other figures is inset in the bottom right. e Scatter plot for the first 3 EBs for 5 dementia syndromes highlighting the differential mapping across the manifold with clinical syndromes coinciding with predictions made by the functional mapping in Fig. 3. The same plot with RGB color mapping for reference to other figures is inset in the bottom right. f The same RGB color mapping used in Fig. 3 indicating the anatomy and state space location for each clinical group (including an example of limbic-predominant age-related TDP-43 encephalopathy [LATE]46). A representative single subject clinical FDG-PET (Cortex ID, GE Healthcare, Chicago, IL, USA) with z-scores relative to age matched controls color-coding the degree of hypometabolism for one patient from each group is also displayed. AU-arbitrary units.

