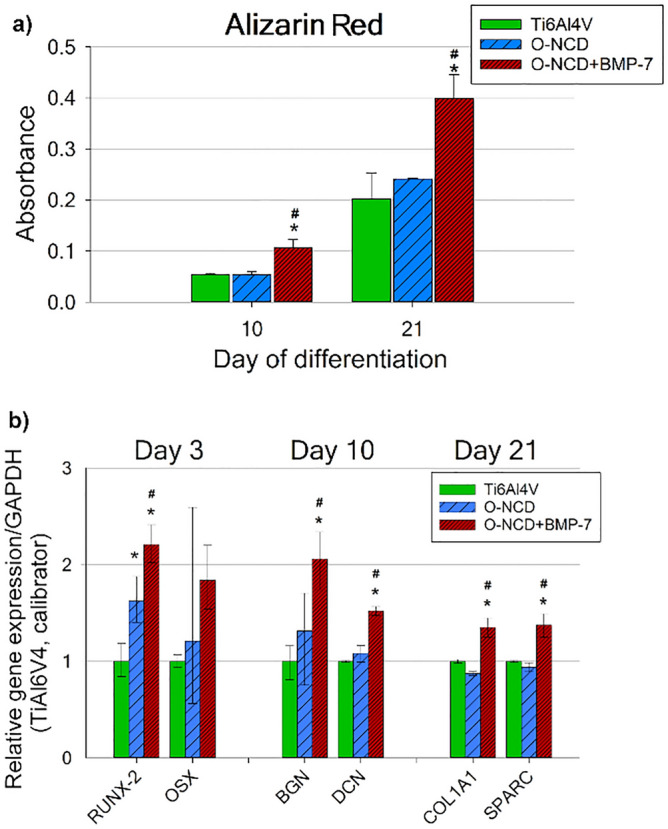
Figure 4.

Mineralization of the extracellular matrix, assessed by Alizarin Red S staining, induced by hFOB 1.19 cells (a), and their relative gene expression (b). The cells were cultured on bare Ti6Al4V samples (Ti6Al4V), on Ti6Al4V samples coated with the O-terminated nanocrystalline diamond coating (O-NCD), or on Ti6Al4V samples coated with the O-terminated nanocrystalline diamond coating functionalized with BMP-7 (O-NCD + BMP-7) under differentiation conditions (a restrictive temperature of 39.5 °C) for 3 weeks. Graph (b) compares the gene expression of osteogenic markers RUNX-2 and OSX (osterix; both early markers), BGN and DCN (biglycan and decorin; mid-term markers) and COL1A1 with SPARC (collagen type I and osteonectin; late markers). The relative mRNA expression was quantified by the method. The data are expressed relative to GAPDH, normalized to gene expression on the reference Ti6Al4V sample (calibrator). Mean ± S.E.M. (a). Mean ± SD (b). * indicates a significant difference from the reference Ti6Al4V, while # shows a significant difference from the O-NCD coating; p < 0.05.
