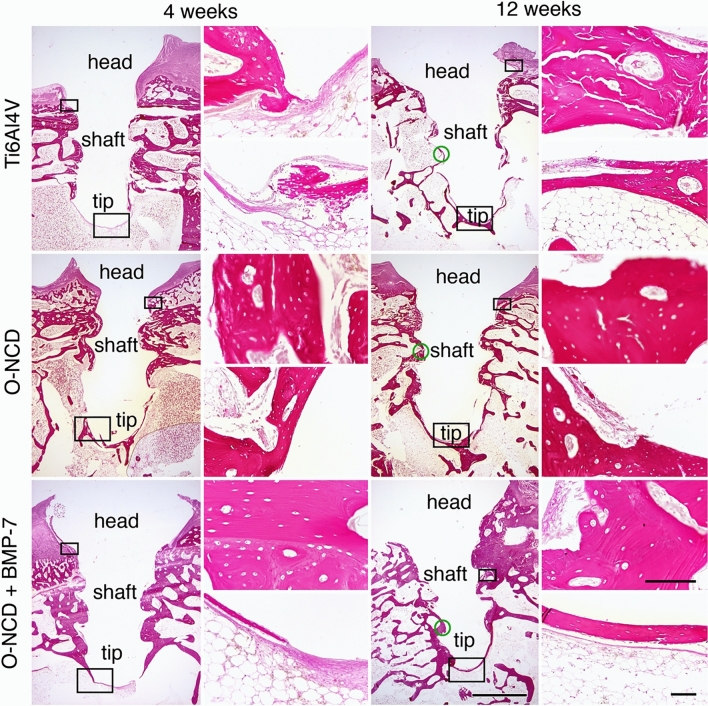
Figure 7.
The histology of the implant site 4 and 12 weeks after the procedure. In contrast to bare metal implants, both coatings promoted bone formation at the screw tip at 4 weeks. Increased thickness of the newly-formed bone is evident in the O-NCD-coated group with a further increase in the O-NCD + BMP-7-coated group in both time intervals, confirming the micro-CT data (Fig. 6). The panel on the left shows the whole implant in elastin staining at low magnification, and the panel on the right shows higher power views from the region of the head and the tip (hematoxylin–eosin staining). Empty spaces correspond to fat cells in the bone marrow. Boxes indicate the approximate position of the high-power views taken on the sister sections. Green circles indicate points of measurements for quantification. Scale bars 1 mm (overview images), 100 µm (high power views).

