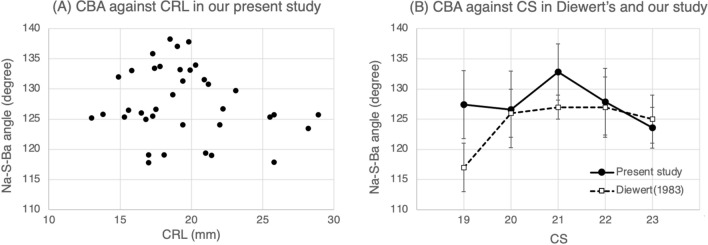
Figure 4.
(A) Scatter plot of CBA against CRL. The distribution of each sample data has a high degree of variability. An approximate curve or line cannot be applied because of a low coefficient of determination for this scatter plot. (B) The mean and SD of CBA in both Diewert’s and our study are shown in the graph based on Table 4A. Our result shows an acute increment of CBA at CS21, whereas Diewert’s result shows flattening after CS20. Comparing only our present results in the two graphs, an acute increment of CBA at CS21 (B) fades away when it is against CRL (A). CBA, cranial base angle; CRL, crown-rump length; CS, Carnegie stage; SD, standard deviation.

