FIGURE 2.

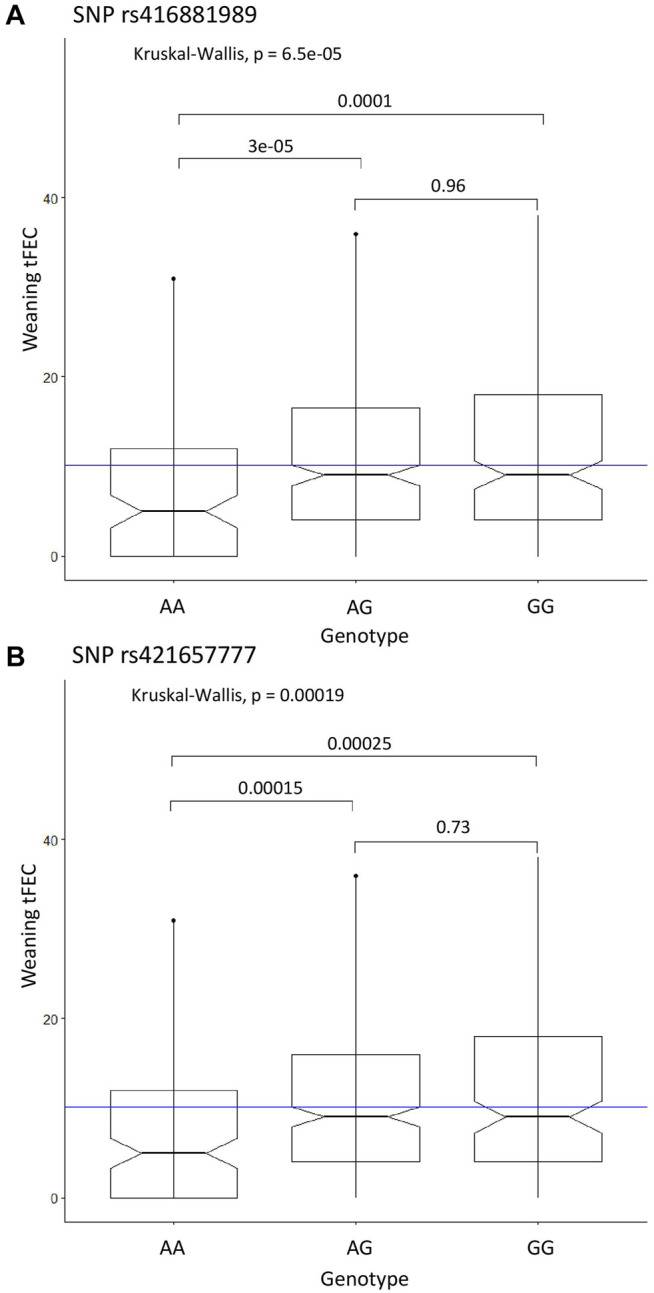
Significant SNP genotypes and weaning tFEC phenotypes from the case-control GWAS. (A) Kruskal-Wallis results for SNP rs416881989, (B) Kruskal-Wallis results for SNP rs421657777. The mean tFEC value is represented by the blue line.

Significant SNP genotypes and weaning tFEC phenotypes from the case-control GWAS. (A) Kruskal-Wallis results for SNP rs416881989, (B) Kruskal-Wallis results for SNP rs421657777. The mean tFEC value is represented by the blue line.