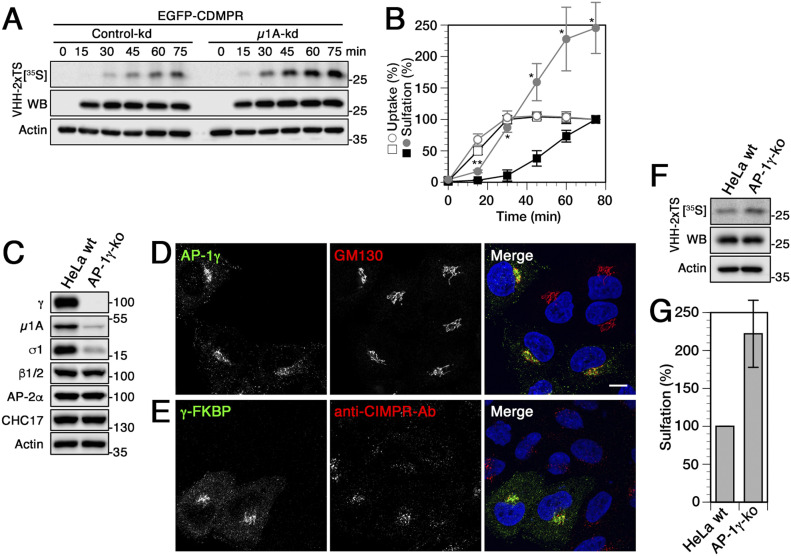
Figure 3. Nanobodies transported to the TGN by CDMPR upon knockdown or knockout of adaptor protein (AP)-1 is hypersulfated.
(A, B) Cells stably expressing EGFP-CDMPR were transfected with non-targeting siRNA (control-kd) or with siRNA silencing expression of μ1A as described in Fig 1. The cells were labeled with [35S]sulfate for up to 75 min in the presence of 2 μg/ml VHH-2xTS and the nanobodies were isolated, analyzed, and quantified as in Fig 2 (mean and SD of three independent experiments; two-sided t test: *P < 0.05; **P < 0.01). Control-kd is shown as black squares and μ1A-kd as gray circles; uptake as open symbols, sulfation as filled symbols. (C) Immunoblot analysis of parental HeLa cells (HeLa wt) and of a pool of γ-adaptin-knockout cells (AP-1γ-ko) generated with CRISPR/Cas9. Equal amounts of cell lysates were probed with antibodies against specific AP-1 subunits (γ, μ1A, σ1), β-adaptins of AP-1 and AP-2 (β1/2), AP-2α, clathrin heavy-chain (CHC17), and actin. (D) Parental HeLa cells and AP-1γ knockout cells were mixed and stained with antibodies targeting AP-1γ or GM130. γ-Adaptin staining was completely absent in knockout cells, whereas Golgi morphology remained intact. (E) AP-1γ knockout cells were transiently transfected with γ-FKBP (a fusion protein of γ-adaptin with FK506 binding protein; see the Materials and Methods section) and incubated with anti-CIMPR antibody for 1 h at 37°C. Cells were fixed and prepared for immunofluorescence microscopy by staining the recombinant γ-subunit and the internalized antibody. Non-transfected cells mostly displayed peripheral accumulation of anti-CIMPR antibody, whereas expression of γ-FKBP largely rescued perinuclear anti-CIMPR antibody localization. Nuclei were stained with DAPI (blue). Bar: 10 μm. (F, G) Parental HeLa and AP-1γ knockout cells were transiently transfected with EGFP-CDMPR, followed by [35S]sulfate labeling for 75 min in the presence of 2 μg/ml VHH-2xTS. The nanobodies were isolated, analyzed, and quantified as in Fig 2 (mean and SD of three independent experiments).

