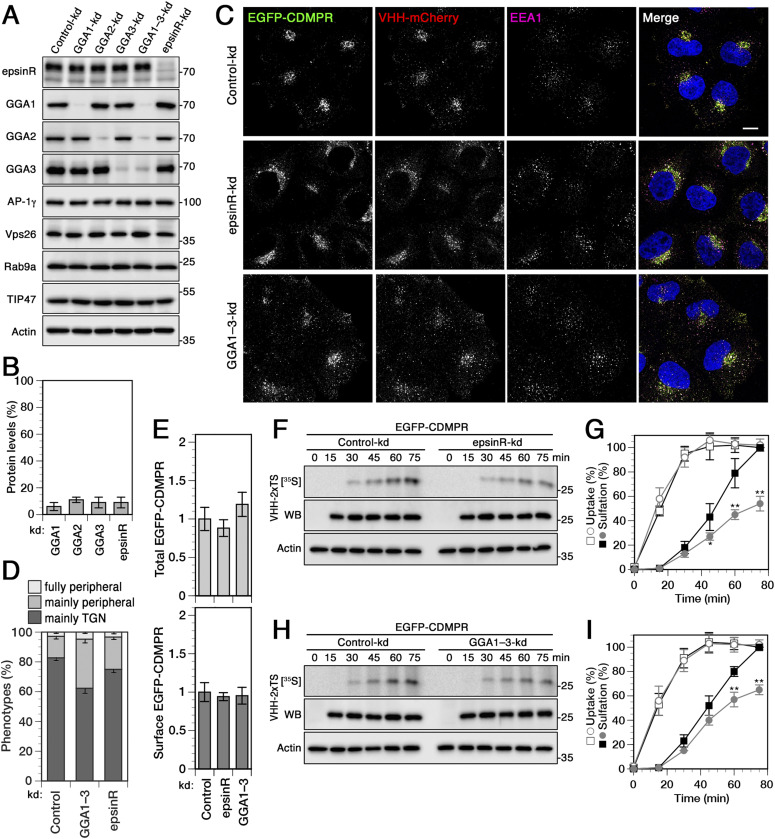
Figure 5. Knockdown of the clathrin adaptors epsinR and GGA1–3 reduces retrograde transport of CDMPR.
(A) HeLa cells were transfected with non-targeting siRNA (Control-kd) or siRNAs targeting GGA1, GGA2, and GGA3, individually or combined (GGA1–3-kd), or epsinR. 3 d after transfection, cells were analyzed by immunoblotting with antibodies against the indicated proteins. (B) To determine the knockdown efficiency, the residual protein was quantified in percent of the value after control-kd (mean and SD of three independent experiments). (C) HeLa cells stably expressing EGFP-CDMPR were depleted of epsinR, or all three GGAs (GGA1–3) as in (B). Cells were incubated for 1 h at 37°C with full medium containing 5 μg/ml VHH-mCherry (∼0.1 μM), fixed, stained for EEA1 and nuclei (DAPI, blue), and imaged by fluorescence microscopy. Bar: 10 μm. (D) Quantitation of the percentage of cells displaying the CDMPR localization phenotypes “mainly TGN,” “mainly peripheral,” or “fully peripheral” (Wassmer et al, 2007; Simonetti et al, 2017). For each condition, random frames with a total of 137–152 cells were scored from three independent experiments. (E) Normalized levels of total and surface EGFP-CDMPR levels in RNAi-silenced cells were quantified by flow cytometry as in Fig 1G and H. Mean fluorescence intensities of each condition were normalized to the average of cells treated with non-targeting control siRNA. For each knockdown condition, 50,000 cells were analyzed in each experiment (mean and SD of three independent experiments). (F, G, H, I) Cells stably expressing EGFP-CDMPR were transfected with non-targeting siRNA (control-kd) or with siRNA silencing expression of epsinR (F, G) or GGA1–3 (H, I) as described in (A). The cells were labeled with [35S]sulfate for up to 75 min in the presence of 2 μg/ml VHH-2xTS and the nanobodies were isolated, analyzed, and quantified as in Fig 2 (mean and SD of three independent experiments; two-sided t test: *P < 0.05; **P < 0.01). Control-kd is shown as black squares and epsinR/GGA1–3-kd as gray circles; uptake as open symbols, sulfation as filled symbols.

