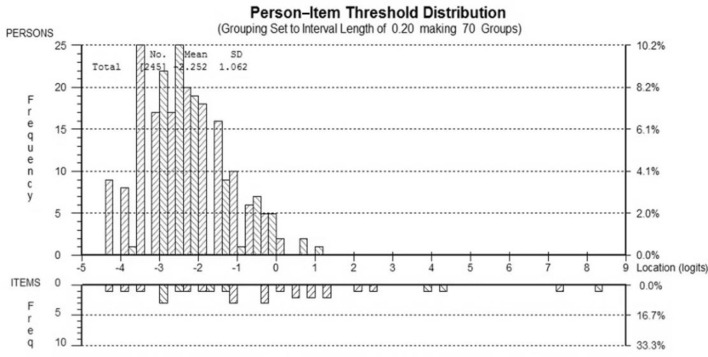
Figure 2.
Person–item location distribution for the EK scale. Targeting of the patient sample (top) to the EK items (bottom). The figure shows the adequate targeting between the distribution of person measurements (upper histogram) and the distribution of item locations (lower histogram). There are no ceiling/floor effects indicated by the range of the person measurements (upper histogram “blocks”) falling within the item locations (lower histogram “blocks”).

