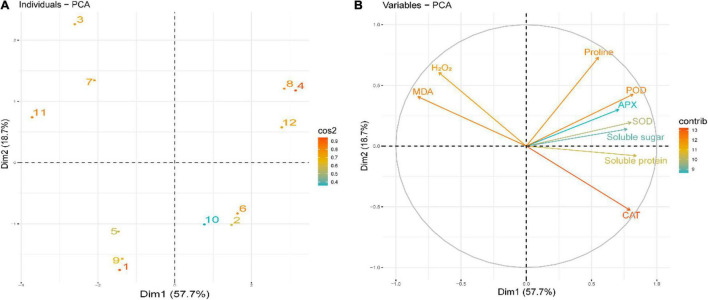
FIGURE 9.
Principal component analysis (PCA) of (A) individual treatments by PCA and (B) different studied indices of rapeseed seedlings grown under four treatments [control (CK), CK + Tre, Cold, and Cold + Tre] and three stress conditions (4, 0, and –4°C). (A) Score plot signifies the partition of treatments as (1) CK_4°C, (2) CK + Tre_4°C, (3) Cold_4°C, (4) Cold + Tre_4°C, (5) CK_0°C, (6) CK + Tre_0°C, (7) Cold_0°C, (8), Cold + Tre_0°C, (9) CK_–4°C, (10) CK + Tre_–4°C, (11), Cold_–4°C, and (12) Cold + Tre_–4°C. Other abbreviations are defined in the main text.

