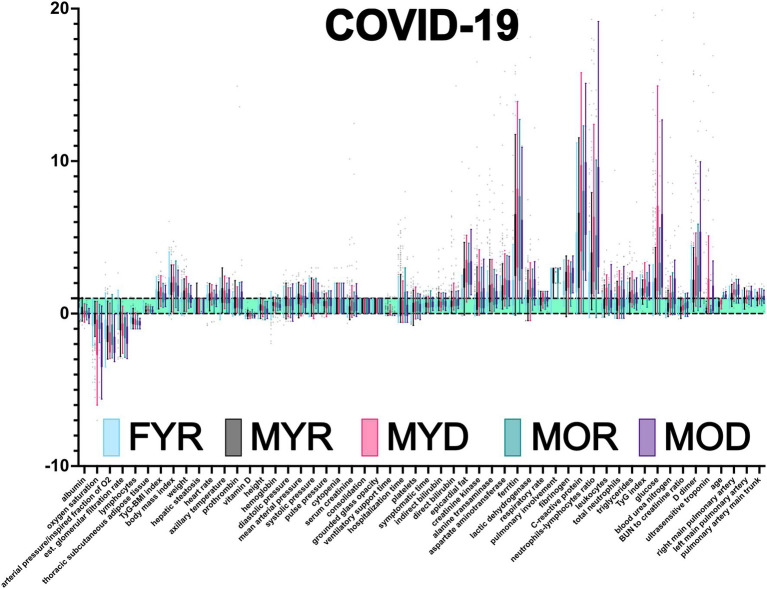
Figure 3.
Database normalization. Using health intervals reported in the literature, the raw data were normalized (Supplementary Tables 1 and 2). Values are presented as Tukey’s box-plots. Values less than 0 are below the acceptable minimum. Values greater than one indicate that the individual has exceeded the highest threshold. Values between 0 and 1 (green shadowing area) are considered healthy.

